Regions Bank 2010 Annual Report Download - page 162
Download and view the complete annual report
Please find page 162 of the 2010 Regions Bank annual report below. You can navigate through the pages in the report by either clicking on the pages listed below, or by using the keyword search tool below to find specific information within the annual report.-
 1
1 -
2
-
3
-
4
-
5
-
6
-
7
-
8
-
9
-
10
-
11
-
12
-
13
-
14
-
15
-
16
-
17
-
18
-
19
-
20
-
21
-
22
-
23
-
24
-
25
-
26
-
27
-
28
-
29
-
30
-
31
-
32
-
33
-
34
-
35
-
36
-
37
-
38
-
39
-
40
-
41
-
42
-
43
-
44
-
45
-
46
-
47
-
48
-
49
-
50
-
51
-
52
-
53
-
54
-
55
-
56
-
57
-
58
-
59
-
60
-
61
-
62
-
63
-
64
-
65
-
66
-
67
-
68
-
69
-
70
-
71
-
72
-
73
-
74
-
75
-
76
-
77
-
78
-
79
-
80
-
81
-
82
-
83
-
84
-
85
-
86
-
87
-
88
-
89
-
90
-
91
-
92
-
93
-
94
-
95
-
96
-
97
-
98
-
99
-
100
-
101
-
102
-
103
-
104
-
105
-
106
-
107
-
108
-
109
-
110
-
111
-
112
-
113
-
114
-
115
-
116
-
117
-
118
-
119
-
120
-
121
-
122
-
123
-
124
-
125
-
126
-
127
-
128
-
129
-
130
-
131
-
132
-
133
-
134
-
135
-
136
-
137
-
138
-
139
-
140
-
141
-
142
-
143
-
144
-
145
-
146
-
147
-
148
-
149
-
150
-
151
-
 152
152 -
 153
153 -
 154
154 -
 155
155 -
 156
156 -
 157
157 -
 158
158 -
 159
159 -
 160
160 -
 161
161 -
 162
162 -
 163
163 -
 164
164 -
 165
165 -
 166
166 -
 167
167 -
 168
168 -
 169
169 -
 170
170 -
 171
171 -
 172
172 -
173
-
174
-
175
-
176
-
177
-
178
-
179
-
180
-
181
-
182
-
183
-
184
-
185
-
186
-
187
-
188
-
189
-
190
-
191
-
192
-
193
-
194
-
195
-
196
-
197
-
198
-
199
-
200
-
201
-
202
-
203
-
204
-
205
-
206
-
207
-
208
-
209
-
210
-
211
-
212
-
213
-
214
-
215
-
216
-
217
-
218
-
219
-
220
-
221
-
222
-
223
-
224
-
225
-
226
-
227
-
228
-
229
-
230
-
231
-
232
-
233
-
234
-
235
-
236
 |
 |

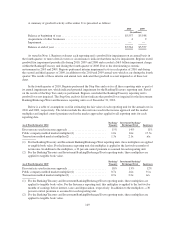
The sensitivity calculations above are hypothetical and should not be considered to be predictive of future
performance. Changes in fair value based on adverse changes in assumptions generally cannot be extrapolated
because the relationship of the change in assumption to the change in fair value may not be linear. Also, the
effect of an adverse variation in a particular assumption on the fair value of the mortgage servicing rights is
calculated without changing any other assumption, while in reality changes in one factor may result in changes in
another which may either magnify or counteract the effect of the change. The derivative instruments utilized by
Regions would serve to reduce the estimated impacts to fair value included in the table above.
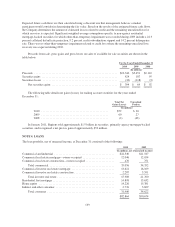
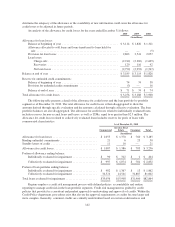
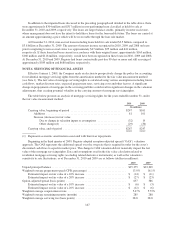
Regions uses various derivative instruments and trading securities to mitigate the effect of changes in the
fair value of its mortgage servicing rights in the statements of operations. The table below presents the impact on
the statements of operations associated with changes in mortgage servicing rights and related derivative and/or
trading securities for the years ended December 31:
2010 2009
(In millions)
Net interest income ................................................ $ 3 $20
Brokerage income ................................................. 4 4
Mortgage income .................................................. 16 13
$23 $37
During 2010, 2009 and 2008, Regions recognized $81 million, $70 million and $86 million, respectively, in
contractually specified servicing fees, late fees and other ancillary income resulting from the servicing of
mortgage loans.
Regions’ recourse liability, which primarily relates to residential mortgage loans, totaled $32 million and
$30 million at December 31, 2010 and 2009, respectively. During the year ended December 31, 2010, $18
million of provision expense (included in other non-interest expense) was recorded and $16 million of losses
were charged-off against the reserve. The recourse liability represents Regions’ estimated credit losses on
contingent repurchases of loans or make-whole payments related to residential mortgage loans previously sold.
This recourse primarily arises due to defects in the underwriting of the sold loans.
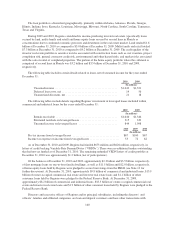
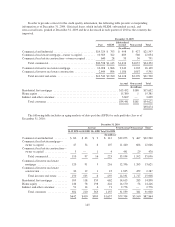
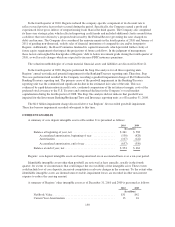
NOTE 7. PREMISES AND EQUIPMENT
A summary of premises and equipment at December 31 is as follows:
2010 2009
(In millions)
Land and land improvements ........................................ $ 509 $ 500
Premises ......................................................... 1,722 1,696
Furniture and equipment ............................................ 1,115 1,143
Software ......................................................... 240 180
Leasehold improvements ............................................ 416 373
Construction in progress ............................................ 173 188
4,175 4,080
Accumulated depreciation and amortization ............................. (1,606) (1,412)
$ 2,569 $ 2,668
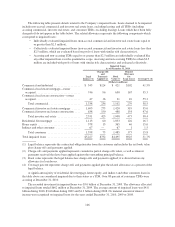
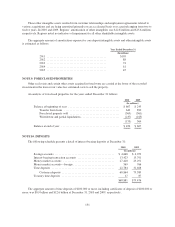
NOTE 8. INTANGIBLE ASSETS
GOODWILL
Goodwill allocated to each reportable segment as of December 31 is presented as follows:
2010 2009
(In millions)
Banking/Treasury ................................................. $4,691 $4,691
Investment Banking/Brokerage/Trust .................................. 745 745
Insurance ........................................................ 125 121
Balance at end of year .............................................. $5,561 $5,557
148