Regions Bank 2010 Annual Report Download - page 124
Download and view the complete annual report
Please find page 124 of the 2010 Regions Bank annual report below. You can navigate through the pages in the report by either clicking on the pages listed below, or by using the keyword search tool below to find specific information within the annual report.-
 1
1 -
2
-
3
-
4
-
5
-
6
-
7
-
8
-
9
-
10
-
11
-
12
-
13
-
14
-
15
-
16
-
17
-
18
-
19
-
20
-
21
-
22
-
23
-
24
-
25
-
26
-
27
-
28
-
29
-
30
-
31
-
32
-
33
-
34
-
35
-
36
-
37
-
38
-
39
-
40
-
41
-
42
-
43
-
44
-
45
-
46
-
47
-
48
-
49
-
50
-
51
-
52
-
53
-
54
-
55
-
56
-
57
-
58
-
59
-
60
-
61
-
62
-
63
-
64
-
65
-
66
-
67
-
68
-
69
-
70
-
71
-
72
-
73
-
74
-
75
-
76
-
77
-
78
-
79
-
80
-
81
-
82
-
83
-
84
-
85
-
86
-
87
-
88
-
89
-
90
-
91
-
92
-
93
-
94
-
95
-
96
-
97
-
98
-
99
-
100
-
101
-
102
-
103
-
104
-
105
-
106
-
107
-
108
-
109
-
110
-
111
-
112
-
113
-
 114
114 -
 115
115 -
 116
116 -
 117
117 -
 118
118 -
 119
119 -
 120
120 -
 121
121 -
 122
122 -
 123
123 -
 124
124 -
 125
125 -
 126
126 -
 127
127 -
 128
128 -
 129
129 -
 130
130 -
 131
131 -
 132
132 -
 133
133 -
 134
134 -
135
-
136
-
137
-
138
-
139
-
140
-
141
-
142
-
143
-
144
-
145
-
146
-
147
-
148
-
149
-
150
-
151
-
152
-
153
-
154
-
155
-
156
-
157
-
158
-
159
-
160
-
161
-
162
-
163
-
164
-
165
-
166
-
167
-
168
-
169
-
170
-
171
-
172
-
173
-
174
-
175
-
176
-
177
-
178
-
179
-
180
-
181
-
182
-
183
-
184
-
185
-
186
-
187
-
188
-
189
-
190
-
191
-
192
-
193
-
194
-
195
-
196
-
197
-
198
-
199
-
200
-
201
-
202
-
203
-
204
-
205
-
206
-
207
-
208
-
209
-
210
-
211
-
212
-
213
-
214
-
215
-
216
-
217
-
218
-
219
-
220
-
221
-
222
-
223
-
224
-
225
-
226
-
227
-
228
-
229
-
230
-
231
-
232
-
233
-
234
-
235
-
236
 |
 |
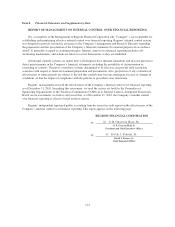
Regions has also established processes to ensure appropriate disclosure controls and procedures are
maintained. These controls and procedures as defined by the Securities and Exchange Commission (“SEC”) are
generally designed to ensure that financial and non-financial information required to be disclosed in reports filed
with the SEC is reported within the time periods specified in the SEC’s rules and forms, and that such
information is communicated to management, including the Chief Executive Officer (“CEO”) and Chief
Financial Officer (“CFO”), as appropriate, to allow timely decisions regarding required disclosure.
Regions’ Disclosure Review Committee, which includes representatives from the legal, risk management,
accounting, investor relations and audit departments, meets quarterly to review recent internal and external
events to determine whether all appropriate disclosures have been made in reports filed with the SEC. In
addition, the CEO and CFO meet quarterly with the SEC Filings Review Committee, which includes senior
representatives from accounting, legal, risk management, audit, and operations and technology, as well as from
the core business segments. The SEC Filings Review Committee reviews certain reports to be filed with the SEC,
including Forms 10-K and 10-Q and evaluates the adequacy and accuracy of the disclosures. As part of this
process, certifications of internal control effectiveness are obtained from all core business segments, accounting,
legal, risk management, and operations and technology. These certifications are reviewed and presented to the
CEO and CFO as evidence of the Company’s assessment of internal controls over financial reporting. The Forms
10-K and 10-Q are presented to the Audit Committee of the Board of Directors for approval. Financial results
and other financial information are also reviewed with the Audit Committee on a quarterly basis.
As required by applicable regulatory pronouncements, the CEO and the CFO review and make various
certifications regarding the accuracy of Regions’ periodic public reports filed with the SEC, as well as the
effectiveness of disclosure controls and procedures and internal controls over financial reporting. With the
assistance of the financial review committees, Regions will continue to assess and monitor disclosure controls
and procedures and internal controls over financial reporting, and will make refinements as necessary.
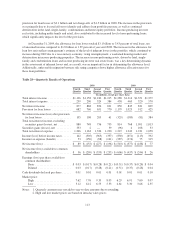
COMPARISON OF 2009 WITH 2008
Regions reported a net loss available to common shareholders of $1.3 billion or $1.27 per diluted common
share in 2009. Significant drivers of 2009 results include an elevated provision for loan losses and pressured net
interest income. Offsetting these items to some extent was Regions’ solid fee and mortgage income.
Net loss from continuing operations in 2009 was $1.3 billion, or $1.27 per diluted common share, compared
to net loss from continuing operations of $5.6 billion, or $8.07 per diluted share in 2008. Regions incurred an $18
million pre-tax loss related to EquiFirst resulting in an after-tax net loss of $11 million, for the year ended
December 31, 2008, which was accounted for as discontinued operations. Net income in 2008 includes after-tax
merger charges of $125 million, or $0.18 per diluted share and a $6 billion non-cash goodwill impairment
charge, or $8.63 per diluted share.
Net interest income was $3.3 billion in 2009 compared to $3.8 billion in 2008. The net interest margin
(taxable-equivalent basis) was 2.67 percent in 2009, compared to 3.23 percent during 2008. The decline in the net
interest margin was impacted primarily by factors directly and indirectly associated with the erosion of economic
and industry conditions since late 2007. These factors include Regions’ asset sensitive balance sheet, which was
impacted by an unfavorable decline in the general level and shape of the yield curve, higher spreads on new debt
issuances, and rising non-performing asset levels. Additionally, loan yields declined throughout the year, as
variable rate loans fell in response to declines in the short-term rates to which they are tied. Declining deposit
rates partially offset these movements, but the decline was somewhat limited by the competitive demand for
deposits within the industry, largely prompted by stressed economic conditions throughout the U.S.
The following discussion of non-interest income and expense is from continuing operations and excludes
EquiFirst, which is reported separately as discontinued operations in the consolidated statements of operations.
Non-interest income totaled $3.8 billion in 2009, compared to $3.1 billion in 2008. The increase in non-interest
110