Regions Bank 2010 Annual Report Download - page 126
Download and view the complete annual report
Please find page 126 of the 2010 Regions Bank annual report below. You can navigate through the pages in the report by either clicking on the pages listed below, or by using the keyword search tool below to find specific information within the annual report.-
 1
1 -
2
-
3
-
4
-
5
-
6
-
7
-
8
-
9
-
10
-
11
-
12
-
13
-
14
-
15
-
16
-
17
-
18
-
19
-
20
-
21
-
22
-
23
-
24
-
25
-
26
-
27
-
28
-
29
-
30
-
31
-
32
-
33
-
34
-
35
-
36
-
37
-
38
-
39
-
40
-
41
-
42
-
43
-
44
-
45
-
46
-
47
-
48
-
49
-
50
-
51
-
52
-
53
-
54
-
55
-
56
-
57
-
58
-
59
-
60
-
61
-
62
-
63
-
64
-
65
-
66
-
67
-
68
-
69
-
70
-
71
-
72
-
73
-
74
-
75
-
76
-
77
-
78
-
79
-
80
-
81
-
82
-
83
-
84
-
85
-
86
-
87
-
88
-
89
-
90
-
91
-
92
-
93
-
94
-
95
-
96
-
97
-
98
-
99
-
100
-
101
-
102
-
103
-
104
-
105
-
106
-
107
-
108
-
109
-
110
-
111
-
112
-
113
-
114
-
115
-
 116
116 -
 117
117 -
 118
118 -
 119
119 -
 120
120 -
 121
121 -
 122
122 -
 123
123 -
 124
124 -
 125
125 -
 126
126 -
 127
127 -
 128
128 -
 129
129 -
 130
130 -
 131
131 -
 132
132 -
 133
133 -
 134
134 -
 135
135 -
 136
136 -
137
-
138
-
139
-
140
-
141
-
142
-
143
-
144
-
145
-
146
-
147
-
148
-
149
-
150
-
151
-
152
-
153
-
154
-
155
-
156
-
157
-
158
-
159
-
160
-
161
-
162
-
163
-
164
-
165
-
166
-
167
-
168
-
169
-
170
-
171
-
172
-
173
-
174
-
175
-
176
-
177
-
178
-
179
-
180
-
181
-
182
-
183
-
184
-
185
-
186
-
187
-
188
-
189
-
190
-
191
-
192
-
193
-
194
-
195
-
196
-
197
-
198
-
199
-
200
-
201
-
202
-
203
-
204
-
205
-
206
-
207
-
208
-
209
-
210
-
211
-
212
-
213
-
214
-
215
-
216
-
217
-
218
-
219
-
220
-
221
-
222
-
223
-
224
-
225
-
226
-
227
-
228
-
229
-
230
-
231
-
232
-
233
-
234
-
235
-
236
 |
 |
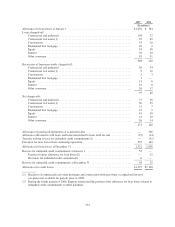
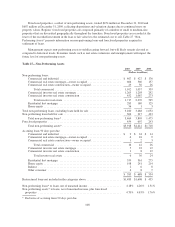
Professional and legal fees are comprised of amounts related to legal, consulting and other professional fees.
These fees increased $95 million to $309 million in 2009. Included in professional fees during 2008 were $7
million of merger-related charges. The increase in 2009 is primarily due to higher legal expenses incurred at
Morgan Keegan and credit-related legal costs (such as legal fees associated with loan work-outs).
Other real estate owned (“OREO”) expenses include the cost of adjusting foreclosed properties to fair value
after these assets have been classified as OREO and net gains and losses on sales of properties, as well as other
costs to maintain the property such as property taxes, security, grounds maintenance, etc. Foreclosed properties
balances increased $364 million to $607 million in 2009 compared to $243 million in 2008 due to increasing
numbers of foreclosures. OREO expense increased $72 million to $175 million in 2009 compared to $103
million in 2008, driven by the significant increase in OREO balances, coupled with property valuation declines
resulting from further deterioration of the housing and real estate markets.
Marketing expenses decreased $22 million during 2009 to $75 million compared to $97 million in 2008.
The decrease was driven by $13 million of merger-related charges in 2008.
Mortgage servicing rights impairment was $85 million in 2008. There was no impairment related to
mortgage servicing rights in 2009 as the Company elected the fair value method as of January 1, 2009.
FDIC premiums, including a special assessment, increased $212 million to $227 million in 2009. The
increases resulted from higher premium rates applied to a higher level of insured deposit balances. The FDIC
made a number of changes to its assessment rate schedule, which drove the increase in premium rates. The bank
regulatory agencies’ ratings, comprised of Regions Bank’s capital, asset quality, management, earnings, liquidity
and sensitivity to risk, along with its long-term debt issuer ratings and financial ratios, were the primary factors in
determining FDIC insurance premiums.
Other miscellaneous expenses include communications, and business development services. Other
miscellaneous expenses decreased $186 million to $736 million in 2009. Included in other miscellaneous
expenses are merger charges totaling $38 million in 2008. The decline in 2009 was attributable to several factors.
As discussed above, in January 2009, Regions began accounting for mortgage servicing rights at fair market
value with any changes to fair value being recorded in mortgage income. At that time, Regions was no longer
required to adjust non-interest expense for amortization of mortgage servicing rights. The impact of the
amortization expense for 2008 was $75 million and there was no corresponding impact in 2009. Also, included in
other non-interest expense in 2008 was $49 million of write-downs on investments in two Morgan Keegan
mutual funds with no similar expense during 2009.
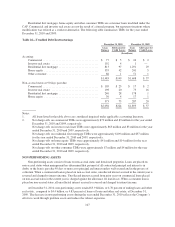
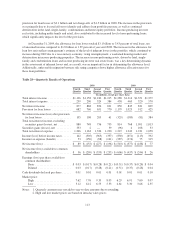
Regions’ 2009 benefit for income taxes from continuing operations decreased $177 million to a tax benefit
of $171 million compared to a tax benefit of $348 million in 2008. The decrease in the benefit is primarily
related to the tax expenses on leveraged lease terminations in 2009.
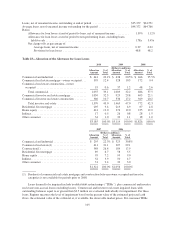
Net charge-offs totaled $2.3 billion, or 2.38 percent of average loans in 2009 compared to $1.5 billion, or
1.59 percent of average loans in 2008. The increased loss rate reflected ongoing pressure in property valuations
and continued strains in the economy as a whole. Non-performing assets increased $2.7 billion between
December 31, 2009 and December 31, 2008 to $4.4 billion, primarily due to continued weakness in the
Company’s land, single-family and condominium portfolios. Non-performing assets held for sale totaled $317
million and $423 million at December 31, 2009 and 2008, respectively.
The provision for loan losses is used to maintain the allowance for loan losses at a level that in
management’s judgment is adequate to cover losses inherent in the portfolio at the balance sheet date. During
2009 the provision for loan losses was $3.5 billion and net charge-offs were $2.3 billion. This compares to a
112