Regions Bank 2010 Annual Report Download - page 112
Download and view the complete annual report
Please find page 112 of the 2010 Regions Bank annual report below. You can navigate through the pages in the report by either clicking on the pages listed below, or by using the keyword search tool below to find specific information within the annual report.-
 1
1 -
2
-
3
-
4
-
5
-
6
-
7
-
8
-
9
-
10
-
11
-
12
-
13
-
14
-
15
-
16
-
17
-
18
-
19
-
20
-
21
-
22
-
23
-
24
-
25
-
26
-
27
-
28
-
29
-
30
-
31
-
32
-
33
-
34
-
35
-
36
-
37
-
38
-
39
-
40
-
41
-
42
-
43
-
44
-
45
-
46
-
47
-
48
-
49
-
50
-
51
-
52
-
53
-
54
-
55
-
56
-
57
-
58
-
59
-
60
-
61
-
62
-
63
-
64
-
65
-
66
-
67
-
68
-
69
-
70
-
71
-
72
-
73
-
74
-
75
-
76
-
77
-
78
-
79
-
80
-
81
-
82
-
83
-
84
-
85
-
86
-
87
-
88
-
89
-
90
-
91
-
92
-
93
-
94
-
95
-
96
-
97
-
98
-
99
-
100
-
101
-
 102
102 -
 103
103 -
 104
104 -
 105
105 -
 106
106 -
 107
107 -
 108
108 -
 109
109 -
 110
110 -
 111
111 -
 112
112 -
 113
113 -
 114
114 -
 115
115 -
 116
116 -
 117
117 -
 118
118 -
 119
119 -
 120
120 -
 121
121 -
 122
122 -
123
-
124
-
125
-
126
-
127
-
128
-
129
-
130
-
131
-
132
-
133
-
134
-
135
-
136
-
137
-
138
-
139
-
140
-
141
-
142
-
143
-
144
-
145
-
146
-
147
-
148
-
149
-
150
-
151
-
152
-
153
-
154
-
155
-
156
-
157
-
158
-
159
-
160
-
161
-
162
-
163
-
164
-
165
-
166
-
167
-
168
-
169
-
170
-
171
-
172
-
173
-
174
-
175
-
176
-
177
-
178
-
179
-
180
-
181
-
182
-
183
-
184
-
185
-
186
-
187
-
188
-
189
-
190
-
191
-
192
-
193
-
194
-
195
-
196
-
197
-
198
-
199
-
200
-
201
-
202
-
203
-
204
-
205
-
206
-
207
-
208
-
209
-
210
-
211
-
212
-
213
-
214
-
215
-
216
-
217
-
218
-
219
-
220
-
221
-
222
-
223
-
224
-
225
-
226
-
227
-
228
-
229
-
230
-
231
-
232
-
233
-
234
-
235
-
236
 |
 |

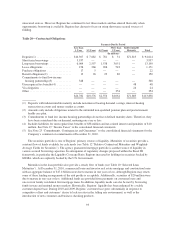
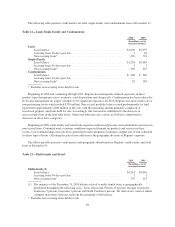
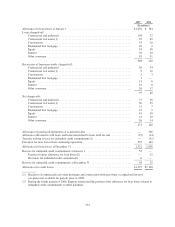
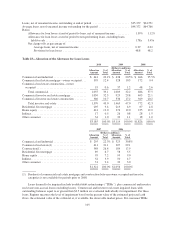
The following table presents credit metrics for land, single-family and condominium loans at December 31:
Table 21—Land, Single-Family and Condominium
2010 2009
(In millions, net of
unearned income)
Land
Loan balance ................................................... $1,640 $2,979
Accruing loans 90 days past due .................................... 1 16
Non-accruing loans* ............................................. 476 724
Single-Family
Loan balance ................................................... $1,236 $2,083
Accruing loans 90 days past due .................................... 3 7
Non-accruing loans* ............................................. 290 545
Condominium
Loan balance ................................................... $ 308 $ 586
Accruing loans 90 days past due .................................... — —
Non-accruing loans* ............................................. 92 184
* Excludes non-accruing loans held for sale.
Beginning in 2008 and continuing through 2010, Regions has strategically reduced exposures in these
product types through pro-active workouts, asset dispositions and charge-offs. Condominium has been reduced to
levels that management no longer considers to be significant exposures. In 2010, Regions executed a bulk sale of
non-performing assets which totaled $350 million. Non-accrual portfolio loans secured predominantly by land
represented approximately $200 million of the sale, with the remaining amount primarily comprised of
foreclosed property and loans held for sale. Accordingly, this transaction contributed to the decrease in
non-accruing loans in the land table above. Other non-bulk note sale activity in 2010 also contributed to
decreases in all of these categories.
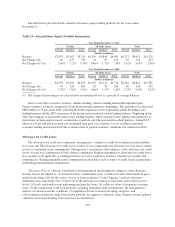
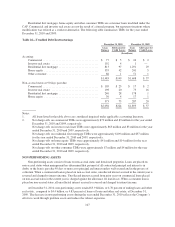
Beginning in 2009, multi-family and retail loans experienced increased pressure and contributed to increases in
non-accrual loans. Continued weak economic conditions impacted demand for products and services in these
sectors. Lower demand impacted cash flows generated by these properties, leading to a higher rate of non-collection
for these types of loans. Offsetting the risk of non-collection is the geographic diversity of Regions’ exposure.
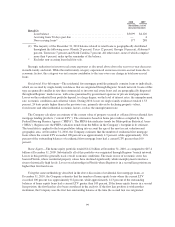
The following table presents credit metrics and geographic distribution for Regions’ multi-family and retail
loans at December 31:
Table 22—Multi-family and Retail
2010 2009
(In millions, net of
unearned income)
Multi-family(1)
Loan balance ................................................... $4,241 $5,049
Accruing loans 90 days past due .................................... 1 1
Non-accruing loans* ............................................. 239 113
(1) The majority of the December 31, 2010 balance related to multi-family loans is geographically
distributed throughout the following areas: Texas 20 percent, Florida 13 percent, Georgia 10 percent,
Tennessee 7 percent, Louisiana 7 percent and North Carolina 6 percent. All other states, none of which
comprise more than 5 percent, make up the remainder of the balance.
* Excludes non-accruing loans held for sale.
98