Regions Bank 2010 Annual Report Download - page 86
Download and view the complete annual report
Please find page 86 of the 2010 Regions Bank annual report below. You can navigate through the pages in the report by either clicking on the pages listed below, or by using the keyword search tool below to find specific information within the annual report.-
 1
1 -
2
-
3
-
4
-
5
-
6
-
7
-
8
-
9
-
10
-
11
-
12
-
13
-
14
-
15
-
16
-
17
-
18
-
19
-
20
-
21
-
22
-
23
-
24
-
25
-
26
-
27
-
28
-
29
-
30
-
31
-
32
-
33
-
34
-
35
-
36
-
37
-
38
-
39
-
40
-
41
-
42
-
43
-
44
-
45
-
46
-
47
-
48
-
49
-
50
-
51
-
52
-
53
-
54
-
55
-
56
-
57
-
58
-
59
-
60
-
61
-
62
-
63
-
64
-
65
-
66
-
67
-
68
-
69
-
70
-
71
-
72
-
73
-
74
-
75
-
 76
76 -
 77
77 -
 78
78 -
 79
79 -
 80
80 -
 81
81 -
 82
82 -
 83
83 -
 84
84 -
 85
85 -
 86
86 -
 87
87 -
 88
88 -
 89
89 -
 90
90 -
 91
91 -
 92
92 -
 93
93 -
 94
94 -
 95
95 -
 96
96 -
97
-
98
-
99
-
100
-
101
-
102
-
103
-
104
-
105
-
106
-
107
-
108
-
109
-
110
-
111
-
112
-
113
-
114
-
115
-
116
-
117
-
118
-
119
-
120
-
121
-
122
-
123
-
124
-
125
-
126
-
127
-
128
-
129
-
130
-
131
-
132
-
133
-
134
-
135
-
136
-
137
-
138
-
139
-
140
-
141
-
142
-
143
-
144
-
145
-
146
-
147
-
148
-
149
-
150
-
151
-
152
-
153
-
154
-
155
-
156
-
157
-
158
-
159
-
160
-
161
-
162
-
163
-
164
-
165
-
166
-
167
-
168
-
169
-
170
-
171
-
172
-
173
-
174
-
175
-
176
-
177
-
178
-
179
-
180
-
181
-
182
-
183
-
184
-
185
-
186
-
187
-
188
-
189
-
190
-
191
-
192
-
193
-
194
-
195
-
196
-
197
-
198
-
199
-
200
-
201
-
202
-
203
-
204
-
205
-
206
-
207
-
208
-
209
-
210
-
211
-
212
-
213
-
214
-
215
-
216
-
217
-
218
-
219
-
220
-
221
-
222
-
223
-
224
-
225
-
226
-
227
-
228
-
229
-
230
-
231
-
232
-
233
-
234
-
235
-
236
 |
 |

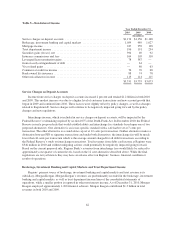
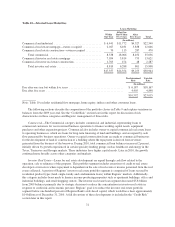
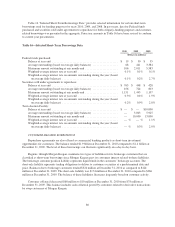
Table 10—Selected Loan Maturities
Loans Maturing
Within
One Year
After One
But Within
Five Years
After
Five Years Total
(In millions)
Commercial and industrial ................................. $ 6,441 $11,772 $4,327 $22,540
Commercial real estate mortgage—owner-occupied ............. 2,027 6,181 3,838 12,046
Commercial real estate construction—owner occupied ........... 70 113 287 470
Total commercial .................................... 8,538 18,066 8,452 35,056
Commercial investor real estate mortgage ..................... 7,054 5,814 753 13,621
Commercial investor real estate construction ................... 1,765 474 48 2,287
Total investor real estate ............................... 8,819 6,288 801 15,908
$17,357 $24,354 $9,253 $50,964
Predetermined
Rate
Variable
Rate
(In millions)
Due after one year but within five years ...................................... $ 6,187 $18,167
Due after five years ...................................................... 4,405 4,848
$10,592 $23,015
Note: Table 10 excludes residential first mortgage, home equity, indirect and other consumer loans.
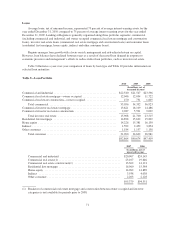
The following sections describe the composition of the portfolio classes in Table 9 and explain variations in
balances from the 2009 year-end. See the “Credit Risk” section later in this report for discussion of risk
characteristics in these categories and Regions’ management of those risks.
Commercial—The Commercial category includes commercial and industrial, representing loans to
commercial customers for use in normal business operations to finance working capital needs, equipment
purchases and other expansion projects. Commercial also includes owner-occupied commercial real estate loans
to operating businesses, which are loans for long-term financing of land and buildings, and are repaid by cash
flow generated by business operations. Owner-occupied construction loans are made to commercial businesses
for the development of land or construction of a building where the repayment is derived from revenues
generated from the business of the borrower. During 2010, total commercial loan balances increased 2 percent,
initially driven by growth experienced in certain specialty lending groups such as healthcare and energy in the
Texas, Tennessee and Georgia markets. These industries have higher capital needs. Later in 2010, the growth
continued more broadly across other categories and markets.
Investor Real Estate—Loans for real estate development are repaid through cash flow related to the
operation, sale or refinance of the property. This portfolio segment includes extensions of credit to real estate
developers or investors where repayment is dependent on the sale of real estate or income generated from the real
estate collateral. A portion of Regions’ investor real estate portfolio segment is comprised of loans secured by
residential product types (land, single-family and condominium loans) within Regions’ markets. Additionally,
this category includes loans made to finance income-producing properties such as apartment buildings, office and
industrial buildings, and retail shopping centers. The investor real estate loan segment decreased $5.8 billion
from 2009 balances primarily due to strategic decisions to reduce the concentration in investor real estate in
response to credit risk and economic pressure. Regions’ goal is to reduce the investor real estate portfolio
segment below one hundred percent of Regions Bank’s risk-based capital, which would have been approximately
$14 billion as of December 31, 2010. A full discussion of these developments is included in the “Credit Risk”
section later in this report.
72