Regions Bank 2010 Annual Report Download - page 183
Download and view the complete annual report
Please find page 183 of the 2010 Regions Bank annual report below. You can navigate through the pages in the report by either clicking on the pages listed below, or by using the keyword search tool below to find specific information within the annual report.-
 1
1 -
2
-
3
-
4
-
5
-
6
-
7
-
8
-
9
-
10
-
11
-
12
-
13
-
14
-
15
-
16
-
17
-
18
-
19
-
20
-
21
-
22
-
23
-
24
-
25
-
26
-
27
-
28
-
29
-
30
-
31
-
32
-
33
-
34
-
35
-
36
-
37
-
38
-
39
-
40
-
41
-
42
-
43
-
44
-
45
-
46
-
47
-
48
-
49
-
50
-
51
-
52
-
53
-
54
-
55
-
56
-
57
-
58
-
59
-
60
-
61
-
62
-
63
-
64
-
65
-
66
-
67
-
68
-
69
-
70
-
71
-
72
-
73
-
74
-
75
-
76
-
77
-
78
-
79
-
80
-
81
-
82
-
83
-
84
-
85
-
86
-
87
-
88
-
89
-
90
-
91
-
92
-
93
-
94
-
95
-
96
-
97
-
98
-
99
-
100
-
101
-
102
-
103
-
104
-
105
-
106
-
107
-
108
-
109
-
110
-
111
-
112
-
113
-
114
-
115
-
116
-
117
-
118
-
119
-
120
-
121
-
122
-
123
-
124
-
125
-
126
-
127
-
128
-
129
-
130
-
131
-
132
-
133
-
134
-
135
-
136
-
137
-
138
-
139
-
140
-
141
-
142
-
143
-
144
-
145
-
146
-
147
-
148
-
149
-
150
-
151
-
152
-
153
-
154
-
155
-
156
-
157
-
158
-
159
-
160
-
161
-
162
-
163
-
164
-
165
-
166
-
167
-
168
-
169
-
170
-
171
-
172
-
 173
173 -
 174
174 -
 175
175 -
 176
176 -
 177
177 -
 178
178 -
 179
179 -
 180
180 -
 181
181 -
 182
182 -
 183
183 -
 184
184 -
 185
185 -
 186
186 -
 187
187 -
 188
188 -
 189
189 -
 190
190 -
 191
191 -
 192
192 -
 193
193 -
194
-
195
-
196
-
197
-
198
-
199
-
200
-
201
-
202
-
203
-
204
-
205
-
206
-
207
-
208
-
209
-
210
-
211
-
212
-
213
-
214
-
215
-
216
-
217
-
218
-
219
-
220
-
221
-
222
-
223
-
224
-
225
-
226
-
227
-
228
-
229
-
230
-
231
-
232
-
233
-
234
-
235
-
236
 |
 |

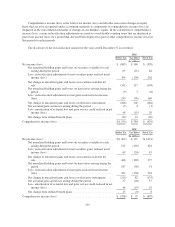
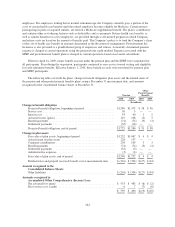
Income tax expense does not reflect the tax effects of unrealized gains and losses on securities available for
sale, unrealized gains and losses on derivative instruments and the net change from defined benefit plans. Refer
to Note 14 for additional information on stockholders’ equity and comprehensive income (loss).
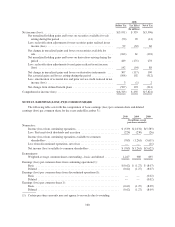
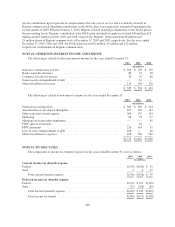
The income tax effects resulting from stock transactions under the Company’s compensation plans were a
decrease to stockholders’ equity of $11 million, $0 million and $16 million in 2010, 2009 and 2008, respectively.
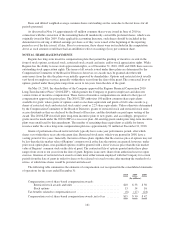
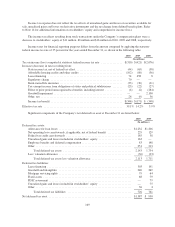
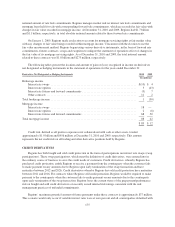
Income taxes for financial reporting purposes differs from the amount computed by applying the statutory
federal income tax rate of 35 percent for the years ended December 31, as shown in the following table:
2010 2009 2008
(In millions)
Tax on income (loss) computed at statutory federal income tax rate ............... $(310) $(421) $(2,076)
Increase (decrease) in taxes resulting from:
State income tax, net of federal tax effect ................................ (44) (65) (38)
Affordable housing credits and other credits .............................. (102) (80) (56)
Lease financing .................................................... 74 458 8
Regulatory charge .................................................. 70 — —
Bank-owned life insurance ............................................ (33) (30) (31)
Tax-exempt income from obligations of states and political subdivisions ....... (23) (22) (27)
Effect of prior period unrecognized tax benefits, including interest ............ (4) (2) (284)
Goodwill impairment ................................................ — — 2,100
Other, net ......................................................... 26 (9) 56
Income tax benefit .................................................. $(346) $(171) $ (348)
Effective tax rate ....................................................... 39.1% 14.2% 5.9%
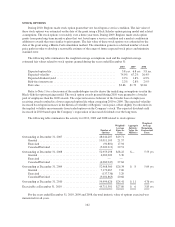
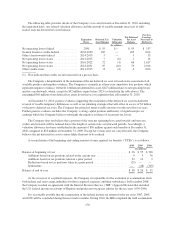
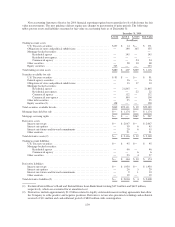
Significant components of the Company’s net deferred tax asset at December 31 are listed below:
2010 2009
(In millions)
Deferred tax assets:
Allowance for loan losses ................................................... $1,232 $1,206
Net operating loss carryfowards, if applicable, net of federal benefit ................. 229 129
Federal tax credit carryforwards .............................................. 185 38
Unrealized gains and losses included in stockholders’ equity ....................... 163 —
Employee benefits and deferred compensation ................................... 83 148
Other ................................................................... 251 213
Total deferred tax assets ................................................ 2,143 1,734
Less: valuation allowance ................................................... (30) (23)
Total deferred tax assets less valuation allowance ............................ 2,113 1,711
Deferred tax liabilities:
Lease financing ........................................................... 303 191
Goodwill and intangibles ................................................... 240 269
Mortgage servicing rights ................................................... 79 64
Fixed assets .............................................................. 68 79
FDIC assessment .......................................................... — 79
Unrealized gains and losses included in stockholders’ equity ....................... — 75
Other ................................................................... 36 4
Total deferred tax liabilities ............................................. 726 761
Net deferred tax asset .......................................................... $1,387 $ 950
169