Regions Bank 2010 Annual Report Download - page 102
Download and view the complete annual report
Please find page 102 of the 2010 Regions Bank annual report below. You can navigate through the pages in the report by either clicking on the pages listed below, or by using the keyword search tool below to find specific information within the annual report.-
 1
1 -
2
-
3
-
4
-
5
-
6
-
7
-
8
-
9
-
10
-
11
-
12
-
13
-
14
-
15
-
16
-
17
-
18
-
19
-
20
-
21
-
22
-
23
-
24
-
25
-
26
-
27
-
28
-
29
-
30
-
31
-
32
-
33
-
34
-
35
-
36
-
37
-
38
-
39
-
40
-
41
-
42
-
43
-
44
-
45
-
46
-
47
-
48
-
49
-
50
-
51
-
52
-
53
-
54
-
55
-
56
-
57
-
58
-
59
-
60
-
61
-
62
-
63
-
64
-
65
-
66
-
67
-
68
-
69
-
70
-
71
-
72
-
73
-
74
-
75
-
76
-
77
-
78
-
79
-
80
-
81
-
82
-
83
-
84
-
85
-
86
-
87
-
88
-
89
-
90
-
91
-
 92
92 -
 93
93 -
 94
94 -
 95
95 -
 96
96 -
 97
97 -
 98
98 -
 99
99 -
 100
100 -
 101
101 -
 102
102 -
 103
103 -
 104
104 -
 105
105 -
 106
106 -
 107
107 -
 108
108 -
 109
109 -
 110
110 -
 111
111 -
 112
112 -
113
-
114
-
115
-
116
-
117
-
118
-
119
-
120
-
121
-
122
-
123
-
124
-
125
-
126
-
127
-
128
-
129
-
130
-
131
-
132
-
133
-
134
-
135
-
136
-
137
-
138
-
139
-
140
-
141
-
142
-
143
-
144
-
145
-
146
-
147
-
148
-
149
-
150
-
151
-
152
-
153
-
154
-
155
-
156
-
157
-
158
-
159
-
160
-
161
-
162
-
163
-
164
-
165
-
166
-
167
-
168
-
169
-
170
-
171
-
172
-
173
-
174
-
175
-
176
-
177
-
178
-
179
-
180
-
181
-
182
-
183
-
184
-
185
-
186
-
187
-
188
-
189
-
190
-
191
-
192
-
193
-
194
-
195
-
196
-
197
-
198
-
199
-
200
-
201
-
202
-
203
-
204
-
205
-
206
-
207
-
208
-
209
-
210
-
211
-
212
-
213
-
214
-
215
-
216
-
217
-
218
-
219
-
220
-
221
-
222
-
223
-
224
-
225
-
226
-
227
-
228
-
229
-
230
-
231
-
232
-
233
-
234
-
235
-
236
 |
 |
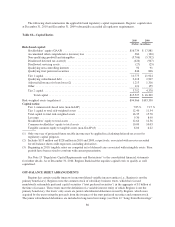
or the credit quality of debt securities and/or 2) the impact to net interest income based on changes in interest
rates and the associated impact on prepayments. Regions’ market risk is made up of three components: interest
rate risk, prepayment risk, and capital markets and brokerage-related risks (primarily associated with Morgan
Keegan). Interest rate risk is the risk to net interest income due to the impact of movements in interest rates.
Prepayment risk is the risk that borrowers may repay their loans or other debt earlier than at their stated
maturities. The Company, primarily through Morgan Keegan, is also subject to various market-related risks
associated with its brokerage and market-related activities. Liquidity risk relates to Regions’ ability to fund
present and future obligations. Counterparty risk represents the risk that a counterparty will not comply with its
contractual obligations. Credit risk represents the risk that parties indebted to Regions fail to perform as
contractually obligated. Regions’ primary credit risk arises from the possibility that borrowers may not be able to
repay loans, and to a lesser extent, the failure of securities issuers and counterparties to perform as contractually
required.
Management follows a formal policy to evaluate and document the key risks facing each line of business,
how those risks can be controlled or mitigated, and how management monitors the controls to ensure that they
are effective. Separate from risk acceptance, there is an independent risk assessment and reporting program. To
ensure that risks within the company are presented and appropriately addressed, the Board has designated a Risk
Committee of outside directors. The Risk Committee’s focus is on Regions’ overall risk profile and the
committee receives reports from the Company quarterly. Additionally, Regions’ Internal Audit Division
performs ongoing, independent reviews of the risk management process which are reported to the Audit
Committee of the Board of Directors.
Some of the more significant processes used to manage and control these and other risks are described in the
remainder of this report. External factors beyond management’s control may result in losses despite risk
management efforts.
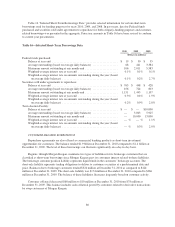
MARKET RISK—INTEREST RATE RISK
Regions’ primary market risk is interest rate risk, including uncertainty with respect to absolute interest rate
levels as well as uncertainty with respect to relative interest rate levels, which is impacted by both the shape and
the slope of the various yield curves that affect the financial products and services that the Company offers. To
quantify this risk, Regions measures the change in its net interest income in various interest rate scenarios
compared to a base case scenario. Net interest income sensitivity is a useful short-term indicator of Regions’
interest rate risk.
Sensitivity Measurement—Financial simulation models are Regions’ primary tools used to measure interest
rate exposure. Using a wide range of sophisticated simulation techniques provides management with extensive
information on the potential impact to net interest income caused by changes in interest rates. Models are
structured to simulate cash flows and accrual characteristics of Regions’ balance sheet. Assumptions are made
about the direction and volatility of interest rates, the slope of the yield curve, and the changing composition of
the balance sheet that result from both strategic plans and from customer behavior. Among the assumptions are
expectations of balance sheet growth and composition, the pricing and maturity characteristics of existing
business and the characteristics of future business. Interest rate-related risks are expressly considered, such as
pricing spreads, the lag time in pricing deposit accounts, prepayments and other option risks. Regions considers
these factors, as well as the degree of certainty or uncertainty surrounding their future behavior.
Historically, Regions’ balance sheet has consisted of a relatively rate-sensitive deposit base that funds a
predominantly floating rate commercial and consumer loan portfolio. This mix of Regions’ core business
activities creates a naturally asset sensitive balance sheet, meaning that increases (decreases) in interest rates
would likely have a positive (negative) cumulative impact on Regions’ net interest income. To manage the
balance sheet’s interest rate risk, Regions maintains a portfolio of largely fixed-rate discretionary investments,
loans and derivatives. The market risk of these discretionary instruments attributable to variation in interest rates
is fully incorporated into the simulation results in the same manner as all other balance sheet instruments.
88