Regions Bank 2010 Annual Report Download - page 119
Download and view the complete annual report
Please find page 119 of the 2010 Regions Bank annual report below. You can navigate through the pages in the report by either clicking on the pages listed below, or by using the keyword search tool below to find specific information within the annual report.-
 1
1 -
2
-
3
-
4
-
5
-
6
-
7
-
8
-
9
-
10
-
11
-
12
-
13
-
14
-
15
-
16
-
17
-
18
-
19
-
20
-
21
-
22
-
23
-
24
-
25
-
26
-
27
-
28
-
29
-
30
-
31
-
32
-
33
-
34
-
35
-
36
-
37
-
38
-
39
-
40
-
41
-
42
-
43
-
44
-
45
-
46
-
47
-
48
-
49
-
50
-
51
-
52
-
53
-
54
-
55
-
56
-
57
-
58
-
59
-
60
-
61
-
62
-
63
-
64
-
65
-
66
-
67
-
68
-
69
-
70
-
71
-
72
-
73
-
74
-
75
-
76
-
77
-
78
-
79
-
80
-
81
-
82
-
83
-
84
-
85
-
86
-
87
-
88
-
89
-
90
-
91
-
92
-
93
-
94
-
95
-
96
-
97
-
98
-
99
-
100
-
101
-
102
-
103
-
104
-
105
-
106
-
107
-
108
-
 109
109 -
 110
110 -
 111
111 -
 112
112 -
 113
113 -
 114
114 -
 115
115 -
 116
116 -
 117
117 -
 118
118 -
 119
119 -
 120
120 -
 121
121 -
 122
122 -
 123
123 -
 124
124 -
 125
125 -
 126
126 -
 127
127 -
 128
128 -
 129
129 -
130
-
131
-
132
-
133
-
134
-
135
-
136
-
137
-
138
-
139
-
140
-
141
-
142
-
143
-
144
-
145
-
146
-
147
-
148
-
149
-
150
-
151
-
152
-
153
-
154
-
155
-
156
-
157
-
158
-
159
-
160
-
161
-
162
-
163
-
164
-
165
-
166
-
167
-
168
-
169
-
170
-
171
-
172
-
173
-
174
-
175
-
176
-
177
-
178
-
179
-
180
-
181
-
182
-
183
-
184
-
185
-
186
-
187
-
188
-
189
-
190
-
191
-
192
-
193
-
194
-
195
-
196
-
197
-
198
-
199
-
200
-
201
-
202
-
203
-
204
-
205
-
206
-
207
-
208
-
209
-
210
-
211
-
212
-
213
-
214
-
215
-
216
-
217
-
218
-
219
-
220
-
221
-
222
-
223
-
224
-
225
-
226
-
227
-
228
-
229
-
230
-
231
-
232
-
233
-
234
-
235
-
236
 |
 |

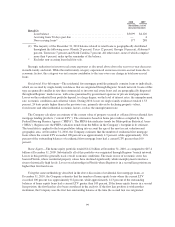
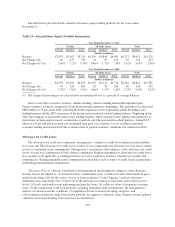
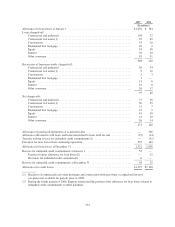
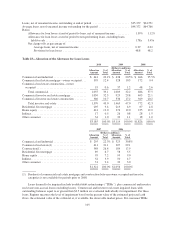
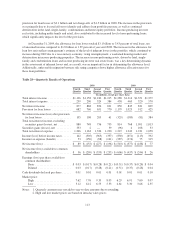
Loans, net of unearned income, outstanding at end of period ......................... $95,379 $94,551
Average loans, net of unearned income outstanding for the period ..................... $94,372 $64,766
Ratios:
Allowance for loan losses at end of period to loans, net of unearned income ......... 1.39% 1.12%
Allowance for loan losses at end of period to non-performing loans, excluding loans
held for sale .......................................................... 1.78x 3.45x
Net charge-offs as percentage of:
Average loans, net of unearned income .................................. 0.29 0.22
Provision for loan losses .............................................. 48.8 98.2
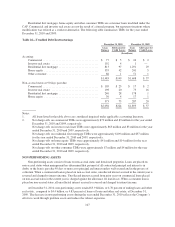
Table 25—Allocation of the Allowance for Loan Losses
2010 2009 2008
(Dollars in millions)
Allocation
Amount
%of
Total
Allocation
Amount
%of
Total
Allocation
Amount
%of
Total
Commercial and industrial ....................... $ 641 20.1% $ 638 20.5% $ 466 25.5%
Commercial real estate mortgage—owner occupied . . . 395 12.4 328 10.5 172 9.4
Commercial real estate construction—owner
occupied ................................... 19 0.6 37 1.2 48 2.6
Total commercial .......................... 1,055 33.1 1,003 32.2 686 37.5
Commercial investor real estate mortgage ........... 1,030 32.3 929 29.8 403 22.1
Commercial investor real estate construction ........ 340 10.7 536 17.2 369 20.2
Total investor real estate .................... 1,370 43.0 1,465 47.0 772 42.3
Residential first mortgage ....................... 295 9.4 213 6.9 87 4.8
Home equity .................................. 414 13.0 374 12.0 235 12.9
Indirect ...................................... 17 0.5 26 0.8 28 1.5
Other consumer ............................... 34 1.0 33 1.1 18 1.0
$3,185 100.0% $3,114 100.0% $1,826 100.0%
2007 2006
(Dollars in millions)
Allocation
Amount
%of
Total
Allocation
Amount
%of
Total
Commercial and industrial ....................... $ 295 22.3% $ 325 30.8%
Commercial real estate(1) ....................... 411 31.1 307 29.1
Construction(1) ............................... 348 26.4 189 17.9
Residential first mortgage ....................... 89 6.7 58 5.5
Home equity .................................. 95 7.2 95 9.0
Indirect ...................................... 52 3.9 50 4.7
Other consumer ............................... 31 2.4 32 3.0
$1,321 100.0% $1,056 100.0%
(1) Breakout of commercial real estate mortgage and construction between owner occupied and investor
categories is not available for periods prior to 2008.
Loans deemed to be impaired include troubled debt restructurings (“TDRs”), plus commercial and investor
real estate non-accrual loans (excluding leases). Commercial and investor real estate impaired loans with
outstanding balances equal to or greater than $2.5 million are evaluated individually for impairment. For these
loans, Regions measures the level of impairment based on the present value of the estimated projected cash
flows, the estimated value of the collateral or, if available, the observable market prices. For consumer TDRs,
105