Regions Bank 2010 Annual Report Download - page 199
Download and view the complete annual report
Please find page 199 of the 2010 Regions Bank annual report below. You can navigate through the pages in the report by either clicking on the pages listed below, or by using the keyword search tool below to find specific information within the annual report.-
 1
1 -
2
-
3
-
4
-
5
-
6
-
7
-
8
-
9
-
10
-
11
-
12
-
13
-
14
-
15
-
16
-
17
-
18
-
19
-
20
-
21
-
22
-
23
-
24
-
25
-
26
-
27
-
28
-
29
-
30
-
31
-
32
-
33
-
34
-
35
-
36
-
37
-
38
-
39
-
40
-
41
-
42
-
43
-
44
-
45
-
46
-
47
-
48
-
49
-
50
-
51
-
52
-
53
-
54
-
55
-
56
-
57
-
58
-
59
-
60
-
61
-
62
-
63
-
64
-
65
-
66
-
67
-
68
-
69
-
70
-
71
-
72
-
73
-
74
-
75
-
76
-
77
-
78
-
79
-
80
-
81
-
82
-
83
-
84
-
85
-
86
-
87
-
88
-
89
-
90
-
91
-
92
-
93
-
94
-
95
-
96
-
97
-
98
-
99
-
100
-
101
-
102
-
103
-
104
-
105
-
106
-
107
-
108
-
109
-
110
-
111
-
112
-
113
-
114
-
115
-
116
-
117
-
118
-
119
-
120
-
121
-
122
-
123
-
124
-
125
-
126
-
127
-
128
-
129
-
130
-
131
-
132
-
133
-
134
-
135
-
136
-
137
-
138
-
139
-
140
-
141
-
142
-
143
-
144
-
145
-
146
-
147
-
148
-
149
-
150
-
151
-
152
-
153
-
154
-
155
-
156
-
157
-
158
-
159
-
160
-
161
-
162
-
163
-
164
-
165
-
166
-
167
-
168
-
169
-
170
-
171
-
172
-
173
-
174
-
175
-
176
-
177
-
178
-
179
-
180
-
181
-
182
-
183
-
184
-
185
-
186
-
187
-
188
-
 189
189 -
 190
190 -
 191
191 -
 192
192 -
 193
193 -
 194
194 -
 195
195 -
 196
196 -
 197
197 -
 198
198 -
 199
199 -
 200
200 -
 201
201 -
 202
202 -
 203
203 -
 204
204 -
 205
205 -
 206
206 -
 207
207 -
 208
208 -
 209
209 -
210
-
211
-
212
-
213
-
214
-
215
-
216
-
217
-
218
-
219
-
220
-
221
-
222
-
223
-
224
-
225
-
226
-
227
-
228
-
229
-
230
-
231
-
232
-
233
-
234
-
235
-
236
 |
 |

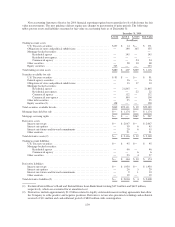
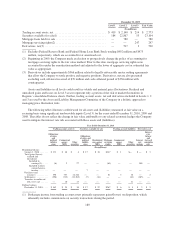
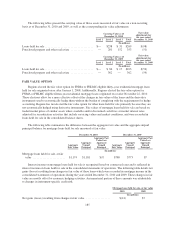
The following tables present the carrying value of those assets measured at fair value on a non-recurring
basis as of December 31, 2010 and 2009, as well as the corresponding fair value adjustments.
Carrying Value as of
December 31, 2010
Fair value
adjustments for
the year ended
December 31, 2010Level 1 Level 2 Level 3 Total
(In millions)
Loans held for sale .................................. $— $238 $ 31 $269 $(98)
Foreclosed property and other real estate ................ — 201 152 353 (51)
Carrying Value as of
December 31, 2009
Fair value
adjustments for
the year ended
December 31, 2009Level 1 Level 2 Level 3 Total
(In millions)
Loans held for sale .................................. $— $ 86 $ 17 $103 $(54)
Foreclosed property and other real estate ................ — 362 — 362 (59)
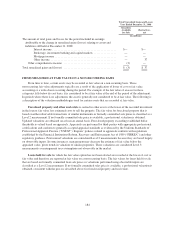
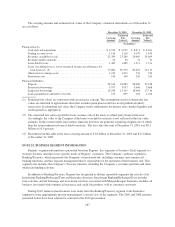
FAIR VALUE OPTION
Regions elected the fair value option for FNMA or FHLMC eligible thirty-year residential mortgage loans
held for sale originated on or after January 1, 2008. Additionally, Regions elected the fair value option for
FNMA or FHLMC eligible fifteen-year residential mortgage loans originated on or after November 22, 2010.
These elections allow for a more effective offset of the changes in fair values of the loans and the derivative
instruments used to economically hedge them without the burden of complying with the requirements for hedge
accounting. Regions has not elected the fair value option for other loans held for sale primarily because they are
not economically hedged using derivative instruments. Fair values of mortgage loans held for sale are based on
traded market prices of similar assets where available and/or discounted cash flows at market interest rates,
adjusted for securitization activities that include servicing values and market conditions, and were recorded in
loans held for sale in the consolidated balance sheets.
The following table summarizes the difference between the aggregate fair value and the aggregate unpaid
principal balance for mortgage loans held for sale measured at fair value:
December 31, 2010 December 31, 2009
Aggregate
Fair Value
Aggregate
Unpaid
Principal
Aggregate Fair
Value Less
Aggregate
Unpaid
Principal
Aggregate
Fair Value
Aggregate
Unpaid
Principal
Aggregate Fair
Value Less
Aggregate
Unpaid
Principal
(In millions)
Mortgage loans held for sale, at fair
value ....................... $1,174 $1,181 $(7) $780 $773 $7
Interest income on mortgage loans held for sale is recognized based on contractual rates and is reflected in
interest income on loans held for sale in the consolidated statements of operations. The following table details net
gains (losses) resulting from changes in fair value of these loans which were recorded in mortgage income in the
consolidated statements of operations during the years ended December 31, 2010 and 2009. These changes in fair
value are mostly offset by economic hedging activities. An immaterial portion of these amounts was attributable
to changes in instrument-specific credit risk.
Mortgage loans held for sale, at fair value
2010 2009
(In millions)
Net gains (losses) resulting from changes in fair value ................. $(14) $7
185