Regions Bank 2010 Annual Report Download - page 169
Download and view the complete annual report
Please find page 169 of the 2010 Regions Bank annual report below. You can navigate through the pages in the report by either clicking on the pages listed below, or by using the keyword search tool below to find specific information within the annual report.-
 1
1 -
2
-
3
-
4
-
5
-
6
-
7
-
8
-
9
-
10
-
11
-
12
-
13
-
14
-
15
-
16
-
17
-
18
-
19
-
20
-
21
-
22
-
23
-
24
-
25
-
26
-
27
-
28
-
29
-
30
-
31
-
32
-
33
-
34
-
35
-
36
-
37
-
38
-
39
-
40
-
41
-
42
-
43
-
44
-
45
-
46
-
47
-
48
-
49
-
50
-
51
-
52
-
53
-
54
-
55
-
56
-
57
-
58
-
59
-
60
-
61
-
62
-
63
-
64
-
65
-
66
-
67
-
68
-
69
-
70
-
71
-
72
-
73
-
74
-
75
-
76
-
77
-
78
-
79
-
80
-
81
-
82
-
83
-
84
-
85
-
86
-
87
-
88
-
89
-
90
-
91
-
92
-
93
-
94
-
95
-
96
-
97
-
98
-
99
-
100
-
101
-
102
-
103
-
104
-
105
-
106
-
107
-
108
-
109
-
110
-
111
-
112
-
113
-
114
-
115
-
116
-
117
-
118
-
119
-
120
-
121
-
122
-
123
-
124
-
125
-
126
-
127
-
128
-
129
-
130
-
131
-
132
-
133
-
134
-
135
-
136
-
137
-
138
-
139
-
140
-
141
-
142
-
143
-
144
-
145
-
146
-
147
-
148
-
149
-
150
-
151
-
152
-
153
-
154
-
155
-
156
-
157
-
158
-
 159
159 -
 160
160 -
 161
161 -
 162
162 -
 163
163 -
 164
164 -
 165
165 -
 166
166 -
 167
167 -
 168
168 -
 169
169 -
 170
170 -
 171
171 -
 172
172 -
 173
173 -
 174
174 -
 175
175 -
 176
176 -
 177
177 -
 178
178 -
 179
179 -
180
-
181
-
182
-
183
-
184
-
185
-
186
-
187
-
188
-
189
-
190
-
191
-
192
-
193
-
194
-
195
-
196
-
197
-
198
-
199
-
200
-
201
-
202
-
203
-
204
-
205
-
206
-
207
-
208
-
209
-
210
-
211
-
212
-
213
-
214
-
215
-
216
-
217
-
218
-
219
-
220
-
221
-
222
-
223
-
224
-
225
-
226
-
227
-
228
-
229
-
230
-
231
-
232
-
233
-
234
-
235
-
236
 |
 |

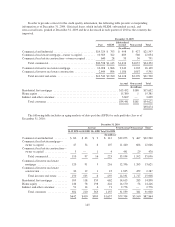
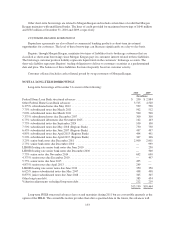
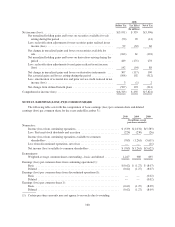
involvement. Approximately $200 million related to term repurchase agreements is also included in other long-
term debt. These arrangements are considered typical of the banking industry and are accounted for as
borrowings.
Regions uses derivative instruments, primarily interest rate swaps, to manage interest rate risk by converting
a portion of its fixed-rate debt to a variable-rate. The effective rate adjustments related to these hedges are
included in interest expense on long-term borrowings. The weighted-average interest rate on total long-term debt,
including the effect of derivative instruments, was 3.2%, 3.6% and 4.6% for the years ended December 31, 2010,
2009 and 2008, respectively. Further discussion of derivative instruments is included in Note 20.
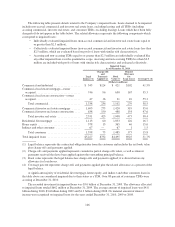
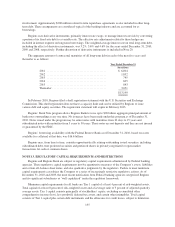
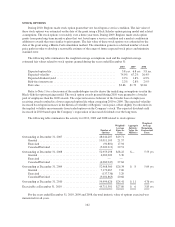
The aggregate amount of contractual maturities of all long-term debt in each of the next five years and
thereafter is as follows:
Year Ended December 31
(In millions)
2011 .......................................... $ 6,004
2012 .......................................... 1,852
2013 .......................................... 745
2014 .......................................... 695
2015 .......................................... 843
Thereafter ...................................... 3,051
$13,190
In February 2010, Regions filed a shelf registration statement with the U.S. Securities and Exchange
Commission. This shelf registration does not have a capacity limit and can be utilized by Regions to issue
various debt and equity securities. The registration statement will expire in February 2013.
Regions’ Bank Note program allows Regions Bank to issue up to $20 billion aggregate principal amount of
bank notes outstanding at any one time. No issuances have been made under this program as of December 31,
2010. Notes issued under the program may be senior notes with maturities from 30 days to 15 years and
subordinated notes with maturities from 5 years to 30 years. These notes are not deposits and they are not insured
or guaranteed by the FDIC.
Regions’ borrowing availability with the Federal Reserve Bank as of December 31, 2010, based on assets
available for collateral at that date, was $16.6 billion.
Regions may, from time to time, consider opportunistically retiring outstanding issued securities, including
subordinated debt, trust preferred securities and preferred shares in privately negotiated or open market
transactions for cash or common shares.
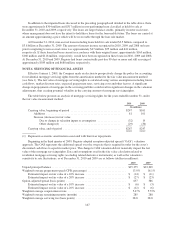
NOTE 13. REGULATORY CAPITAL REQUIREMENTS AND RESTRICTIONS
Regions and Regions Bank are subject to regulatory capital requirements administered by Federal banking
agencies. These regulatory capital requirements involve quantitative measures of the Company’s assets, liabilities
and certain off-balance sheet items, and also qualitative judgments by the regulators. Failure to meet minimum
capital requirements can subject the Company to a series of increasingly restrictive regulatory actions. As of
December 31, 2010 and 2009, the most recent notification from Federal banking agencies categorized Regions
and its significant subsidiaries as “well capitalized” under the regulatory framework.
Minimum capital requirements for all banks are Tier 1 capital of at least 4 percent of risk-weighted assets,
Total capital of at least 8 percent of risk-weighted assets and a Leverage ratio of 3 percent of adjusted quarterly
average assets. Tier 1 capital consists principally of stockholders’ equity, excluding accumulated other
comprehensive income (loss), less goodwill, deferred tax assets, and certain other intangibles. Total capital
consists of Tier 1 capital plus certain debt instruments and the allowance for credit losses, subject to limitation.
155