Regions Bank 2010 Annual Report Download - page 208
Download and view the complete annual report
Please find page 208 of the 2010 Regions Bank annual report below. You can navigate through the pages in the report by either clicking on the pages listed below, or by using the keyword search tool below to find specific information within the annual report.-
 1
1 -
2
-
3
-
4
-
5
-
6
-
7
-
8
-
9
-
10
-
11
-
12
-
13
-
14
-
15
-
16
-
17
-
18
-
19
-
20
-
21
-
22
-
23
-
24
-
25
-
26
-
27
-
28
-
29
-
30
-
31
-
32
-
33
-
34
-
35
-
36
-
37
-
38
-
39
-
40
-
41
-
42
-
43
-
44
-
45
-
46
-
47
-
48
-
49
-
50
-
51
-
52
-
53
-
54
-
55
-
56
-
57
-
58
-
59
-
60
-
61
-
62
-
63
-
64
-
65
-
66
-
67
-
68
-
69
-
70
-
71
-
72
-
73
-
74
-
75
-
76
-
77
-
78
-
79
-
80
-
81
-
82
-
83
-
84
-
85
-
86
-
87
-
88
-
89
-
90
-
91
-
92
-
93
-
94
-
95
-
96
-
97
-
98
-
99
-
100
-
101
-
102
-
103
-
104
-
105
-
106
-
107
-
108
-
109
-
110
-
111
-
112
-
113
-
114
-
115
-
116
-
117
-
118
-
119
-
120
-
121
-
122
-
123
-
124
-
125
-
126
-
127
-
128
-
129
-
130
-
131
-
132
-
133
-
134
-
135
-
136
-
137
-
138
-
139
-
140
-
141
-
142
-
143
-
144
-
145
-
146
-
147
-
148
-
149
-
150
-
151
-
152
-
153
-
154
-
155
-
156
-
157
-
158
-
159
-
160
-
161
-
162
-
163
-
164
-
165
-
166
-
167
-
168
-
169
-
170
-
171
-
172
-
173
-
174
-
175
-
176
-
177
-
178
-
179
-
180
-
181
-
182
-
183
-
184
-
185
-
186
-
187
-
188
-
189
-
190
-
191
-
192
-
193
-
194
-
195
-
196
-
197
-
 198
198 -
 199
199 -
 200
200 -
 201
201 -
 202
202 -
 203
203 -
 204
204 -
 205
205 -
 206
206 -
 207
207 -
 208
208 -
 209
209 -
 210
210 -
 211
211 -
 212
212 -
 213
213 -
 214
214 -
 215
215 -
 216
216 -
 217
217 -
 218
218 -
219
-
220
-
221
-
222
-
223
-
224
-
225
-
226
-
227
-
228
-
229
-
230
-
231
-
232
-
233
-
234
-
235
-
236
 |
 |

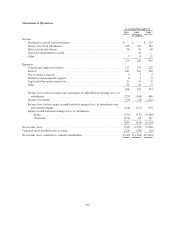
Statements of Operations
Year Ended December 31
2010 2009 2008
(In millions)
Income:
Dividends received from subsidiaries .................................. $— $ — $ 725
Service fees from subsidiaries ........................................ 128 123 183
Interest from subsidiaries ........................................... 24 16 40
Gain on extinguishment of debt ...................................... — 61 —
Other ........................................................... 7 8 11
159 208 959
Expenses:
Salaries and employee benefits ....................................... 117 133 226
Interest .......................................................... 183 162 240
Net occupancy expense ............................................. 9 4 2
Furniture and equipment expense ..................................... 8 7 6
Legal and other professional fees ..................................... 21 14 6
Other ........................................................... 50 36 73
388 356 553
Income (loss) before income taxes and equity in undistributed earnings (loss) of
subsidiaries .................................................... (229) (148) 406
Income tax benefit ................................................. (93) (31) (127)
Income (loss) before equity in undistributed earnings (loss) of subsidiaries and
preferred dividends .............................................. (136) (117) 533
Equity in undistributed earnings (loss) of subsidiaries:
Banks ....................................................... (252) (978) (6,240)
Non-banks ................................................... (151) 64 111
(403) (914) (6,129)
Net income (loss) ..................................................... (539) (1,031) (5,596)
Preferred stock dividends and accretion .................................... (224) (230) (26)
Net income (loss) available to common shareholders .......................... $(763) $(1,261) $(5,622)
194