Regions Bank 2010 Annual Report Download - page 65
Download and view the complete annual report
Please find page 65 of the 2010 Regions Bank annual report below. You can navigate through the pages in the report by either clicking on the pages listed below, or by using the keyword search tool below to find specific information within the annual report.-
 1
1 -
2
-
3
-
4
-
5
-
6
-
7
-
8
-
9
-
10
-
11
-
12
-
13
-
14
-
15
-
16
-
17
-
18
-
19
-
20
-
21
-
22
-
23
-
24
-
25
-
26
-
27
-
28
-
29
-
30
-
31
-
32
-
33
-
34
-
35
-
36
-
37
-
38
-
39
-
40
-
41
-
42
-
43
-
44
-
45
-
46
-
47
-
48
-
49
-
50
-
51
-
52
-
53
-
54
-
 55
55 -
 56
56 -
 57
57 -
 58
58 -
 59
59 -
 60
60 -
 61
61 -
 62
62 -
 63
63 -
 64
64 -
 65
65 -
 66
66 -
 67
67 -
 68
68 -
 69
69 -
 70
70 -
 71
71 -
 72
72 -
 73
73 -
 74
74 -
 75
75 -
76
-
77
-
78
-
79
-
80
-
81
-
82
-
83
-
84
-
85
-
86
-
87
-
88
-
89
-
90
-
91
-
92
-
93
-
94
-
95
-
96
-
97
-
98
-
99
-
100
-
101
-
102
-
103
-
104
-
105
-
106
-
107
-
108
-
109
-
110
-
111
-
112
-
113
-
114
-
115
-
116
-
117
-
118
-
119
-
120
-
121
-
122
-
123
-
124
-
125
-
126
-
127
-
128
-
129
-
130
-
131
-
132
-
133
-
134
-
135
-
136
-
137
-
138
-
139
-
140
-
141
-
142
-
143
-
144
-
145
-
146
-
147
-
148
-
149
-
150
-
151
-
152
-
153
-
154
-
155
-
156
-
157
-
158
-
159
-
160
-
161
-
162
-
163
-
164
-
165
-
166
-
167
-
168
-
169
-
170
-
171
-
172
-
173
-
174
-
175
-
176
-
177
-
178
-
179
-
180
-
181
-
182
-
183
-
184
-
185
-
186
-
187
-
188
-
189
-
190
-
191
-
192
-
193
-
194
-
195
-
196
-
197
-
198
-
199
-
200
-
201
-
202
-
203
-
204
-
205
-
206
-
207
-
208
-
209
-
210
-
211
-
212
-
213
-
214
-
215
-
216
-
217
-
218
-
219
-
220
-
221
-
222
-
223
-
224
-
225
-
226
-
227
-
228
-
229
-
230
-
231
-
232
-
233
-
234
-
235
-
236
 |
 |

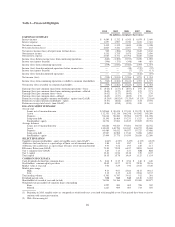
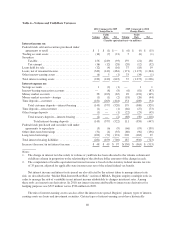
For Years Ended December 31
2010 2009 2008 2007 2006
(In millions, except per share data)
EFFICIENCY RATIO
Non-interest expense (GAAP) ...................... $ 4,985 $ 4,751 $ 10,792 $ 4,660 $ 3,204
Adjustments:
Merger-related charges ........................ — — (201) (351) (89)
Goodwill impairment ......................... — — (6,000) — —
Regulatory charge ........................... (200) — — — —
Mortgage servicing rights impairment ............ — — (85) (6) (16)
Loss on extinguishment of debt ................. (108) — (66) — —
FDIC special assessment ...................... — (64) — — —
Securities impairment, net ..................... (2) (75) (23) (7) —
Branch consolidation costs ..................... (8) (53) — — —
Adjusted non-interest expense (non-GAAP) ........... D $ 4,667 $ 4,559 $ 4,417 $ 4,296 $ 3,099
Net interest income, taxable-equivalent basis
(GAAP) .................................... $ 3,464 $ 3,367 $ 3,880 $ 4,437 $ 3,469
Non-interest income (GAAP) ..................... 3,531 3,755 3,073 2,856 2,030
Adjustments:
Securities (gains) losses, net .................. (394) (69) (92) 9 (8)
Leveraged lease termination gains ............. (78) (587) — — —
Visa-related gains .......................... — (80) (63) — —
Gain on early extinguishment of debt ........... — (61) — — —
Gain on sale of mortgage loans ................ (26) — — — —
Adjusted non-interest income (non-GAAP) .......... 3,033 2,958 2,918 2,865 2,022
Adjusted total revenue (non-GAAP) ................ E $ 6,497 $ 6,325 $ 6,798 $ 7,302 $ 5,491
Efficiency ratio (non-GAAP) ..................... D/E 71.83% 72.08% 64.97% 58.83% 56.44%
RETURN ON AVERAGE ASSETS
Average assets (GAAP) ......................... F $135,955 $142,759 $143,947 $138,757 $95,800
Return on average assets (GAAP) .................. A/F -0.56% -0.88% -3.90% 0.90% 1.41%
Return on average assets, excluding merger, goodwill
impairment and regulatory charges (non-GAAP) .... B/F -0.41% -0.88% 0.36% 1.16% 1.50%
RETURN ON AVERAGE TANGIBLE COMMON
STOCKHOLDERS’ EQUITY(1)
Average stockholders’ equity (GAAP) .............. $ 17,444 $ 17,773 $ 19,939 $ 20,036 $12,369
Average intangible assets (GAAP) ................. 6,003 6,122 11,949 12,130 6,450
Average deferred tax liability related to intangibles
(GAAP) .................................... (255) (286) (321) (370) (185)
Average preferred equity (GAAP) ................. 3,479 3,487 425 — —
Average tangible common stockholders’ equity (non-
GAAP) ..................................... G $ 8,217 $ 8,450 $ 7,886 $ 8,276 $ 6,104
Average stockholders’ equity, excluding discontinued
operations (GAAP) ........................... $ 17,444 $ 17,773 $ 19,939 $ 20,013 $12,215
Average intangible assets, excluding discontinued
operations (GAAP) ........................... 6,003 6,122 11,949 12,130 6,450
Average deferred tax liability related to intangibles
(GAAP) .................................... (255) (286) (321) (370) (185)
Average preferred equity (GAAP) ................. 3,479 3,487 425 — —
Average tangible common equity, excluding
discontinued operations (non-GAAP) ............. H $ 8,217 $ 8,450 $ 7,886 $ 8,253 $ 5,950
Return on average tangible common equity (non-
GAAP) ..................................... A/G -9.29% -14.92% -71.29% 15.12% 22.18%
Return on average tangible common equity, excluding
discontinued operations, merger, goodwill
impairment and regulatory charges (non-GAAP) .... B/H -6.85% -14.92% 6.52% 19.53% 24.08%
51