Regions Bank 2010 Annual Report Download - page 115
Download and view the complete annual report
Please find page 115 of the 2010 Regions Bank annual report below. You can navigate through the pages in the report by either clicking on the pages listed below, or by using the keyword search tool below to find specific information within the annual report.-
 1
1 -
2
-
3
-
4
-
5
-
6
-
7
-
8
-
9
-
10
-
11
-
12
-
13
-
14
-
15
-
16
-
17
-
18
-
19
-
20
-
21
-
22
-
23
-
24
-
25
-
26
-
27
-
28
-
29
-
30
-
31
-
32
-
33
-
34
-
35
-
36
-
37
-
38
-
39
-
40
-
41
-
42
-
43
-
44
-
45
-
46
-
47
-
48
-
49
-
50
-
51
-
52
-
53
-
54
-
55
-
56
-
57
-
58
-
59
-
60
-
61
-
62
-
63
-
64
-
65
-
66
-
67
-
68
-
69
-
70
-
71
-
72
-
73
-
74
-
75
-
76
-
77
-
78
-
79
-
80
-
81
-
82
-
83
-
84
-
85
-
86
-
87
-
88
-
89
-
90
-
91
-
92
-
93
-
94
-
95
-
96
-
97
-
98
-
99
-
100
-
101
-
102
-
103
-
104
-
 105
105 -
 106
106 -
 107
107 -
 108
108 -
 109
109 -
 110
110 -
 111
111 -
 112
112 -
 113
113 -
 114
114 -
 115
115 -
 116
116 -
 117
117 -
 118
118 -
 119
119 -
 120
120 -
 121
121 -
 122
122 -
 123
123 -
 124
124 -
 125
125 -
126
-
127
-
128
-
129
-
130
-
131
-
132
-
133
-
134
-
135
-
136
-
137
-
138
-
139
-
140
-
141
-
142
-
143
-
144
-
145
-
146
-
147
-
148
-
149
-
150
-
151
-
152
-
153
-
154
-
155
-
156
-
157
-
158
-
159
-
160
-
161
-
162
-
163
-
164
-
165
-
166
-
167
-
168
-
169
-
170
-
171
-
172
-
173
-
174
-
175
-
176
-
177
-
178
-
179
-
180
-
181
-
182
-
183
-
184
-
185
-
186
-
187
-
188
-
189
-
190
-
191
-
192
-
193
-
194
-
195
-
196
-
197
-
198
-
199
-
200
-
201
-
202
-
203
-
204
-
205
-
206
-
207
-
208
-
209
-
210
-
211
-
212
-
213
-
214
-
215
-
216
-
217
-
218
-
219
-
220
-
221
-
222
-
223
-
224
-
225
-
226
-
227
-
228
-
229
-
230
-
231
-
232
-
233
-
234
-
235
-
236
 |
 |
Commercial and Consumer Credit Risk Management and Special Assets are all involved in the credit risk
management process to assess the accuracy of risk ratings, the quality of the portfolio and the estimation of
inherent credit losses in the loan portfolio. This comprehensive process also assists in the prompt identification of
problem credits. The Company has taken a number of measures to manage the portfolios and reduce risk,
particularly in the more problematic portfolios. In addition, a strong Customer Assistance Program is in place
which educates customers about options and initiates early contact with customers to discuss solutions when a
loan first becomes delinquent.
For loans that are not specifically reviewed, management uses information from its ongoing review
processes to stratify the loan portfolio into pools sharing common risk characteristics. Loans that share common
risk characteristics are assigned a portion of the allowance for credit losses based on the assessment process
described above. Credit exposures are categorized by type and assigned estimated amounts of inherent loss based
on several factors, including current and historical loss experience for each pool and management’s judgment of
current economic conditions and their expected impact on credit performance. Adjustments to the allowance for
credit losses calculated using a pooled approach are recorded through the provision for loan losses or noninterest
expense, as applicable.
As a matter of business practice, Regions may require some form of credit support, such as a guarantee.
Guarantees are legally binding and entered into simultaneously with the primary loan agreements. Regions
underwrites the ability of each guarantor to perform under its guarantee in the same manner and to the same
extent as would be required to underwrite the repayment plan of a direct obligor. This entails obtaining sufficient
information on the guarantor, including financial and operating information, to sufficiently measure a guarantor’s
ability to perform, under the guarantee. However, the benefit assigned to credit support within the calculation of
the allowance for credit losses is not material to the consolidated financial statements.
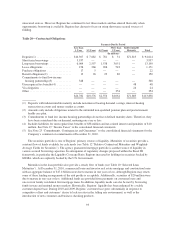
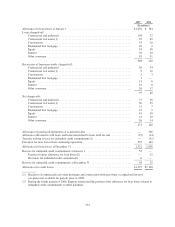
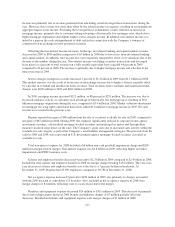
At December 31, 2010, the allowance for loan losses totaled $3.2 billion or 3.84 percent of total loans, net
of unearned income compared to $3.1 billion or 3.43 percent at year-end 2009. The increase in the allowance for
loan loss ratio reflects management’s estimate of the level of inherent losses in the portfolio, which stabilized
during 2010, as well as a result of the decline in the loan portfolio balance.
Non-performing assets decreased from $4.4 billion at December 31, 2009 to $3.9 billion at December 31,
2010, reflecting management’s efforts to work through problem assets.
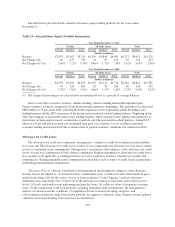
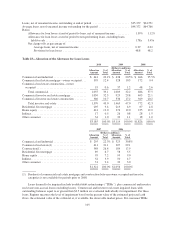
Higher levels of charge-offs in 2010 as described below were also a factor in the allowance for credit losses.
Net charge-offs as a percentage of average loans were 3.22 percent and 2.38 percent in 2010 and 2009,
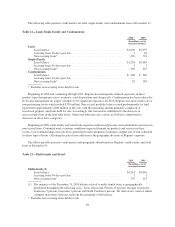
respectively. Charge-off ratios were higher across most major classes. Investor real estate losses were the largest
contributor, reflecting increased charge-offs in the land, single-family and retail components of investor real
estate. Increased charge-offs reflect the impact of opportunistic asset dispositions.
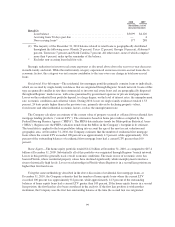
Net charge-offs on home equity rose to 2.80 percent in 2010 versus 2.63 percent in 2009. Losses from
Florida-based credits were again particularly high, as property valuations in certain markets continued to
experience deterioration. These loans and lines represent approximately $5.2 billion of Regions’ total home
equity portfolio at December 31, 2010. Of that balance, approximately $2.1 billion represents first liens; second
liens, which total $3.1 billion, were the main source of losses. Florida second lien losses were 7.12 percent in
2010. Total home equity losses in Florida amounted to 5.38 percent of loans and lines versus 1.30 percent across
the remainder of Regions’ footprint in 2010.
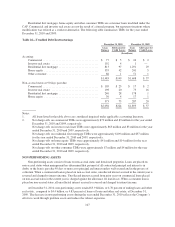
Management expects charge-offs to moderate going forward, but will likely remain elevated. Real estate
valuations and unemployment will impact the future level of charge-offs.
Management considers the current level of allowance for credit losses adequate to absorb losses inherent in
the loan portfolio and unfunded commitments. Management’s determination of the adequacy of the allowance for
101