Regions Bank 2010 Annual Report Download - page 73
Download and view the complete annual report
Please find page 73 of the 2010 Regions Bank annual report below. You can navigate through the pages in the report by either clicking on the pages listed below, or by using the keyword search tool below to find specific information within the annual report.-
 1
1 -
2
-
3
-
4
-
5
-
6
-
7
-
8
-
9
-
10
-
11
-
12
-
13
-
14
-
15
-
16
-
17
-
18
-
19
-
20
-
21
-
22
-
23
-
24
-
25
-
26
-
27
-
28
-
29
-
30
-
31
-
32
-
33
-
34
-
35
-
36
-
37
-
38
-
39
-
40
-
41
-
42
-
43
-
44
-
45
-
46
-
47
-
48
-
49
-
50
-
51
-
52
-
53
-
54
-
55
-
56
-
57
-
58
-
59
-
60
-
61
-
62
-
 63
63 -
 64
64 -
 65
65 -
 66
66 -
 67
67 -
 68
68 -
 69
69 -
 70
70 -
 71
71 -
 72
72 -
 73
73 -
 74
74 -
 75
75 -
 76
76 -
 77
77 -
 78
78 -
 79
79 -
 80
80 -
 81
81 -
 82
82 -
 83
83 -
84
-
85
-
86
-
87
-
88
-
89
-
90
-
91
-
92
-
93
-
94
-
95
-
96
-
97
-
98
-
99
-
100
-
101
-
102
-
103
-
104
-
105
-
106
-
107
-
108
-
109
-
110
-
111
-
112
-
113
-
114
-
115
-
116
-
117
-
118
-
119
-
120
-
121
-
122
-
123
-
124
-
125
-
126
-
127
-
128
-
129
-
130
-
131
-
132
-
133
-
134
-
135
-
136
-
137
-
138
-
139
-
140
-
141
-
142
-
143
-
144
-
145
-
146
-
147
-
148
-
149
-
150
-
151
-
152
-
153
-
154
-
155
-
156
-
157
-
158
-
159
-
160
-
161
-
162
-
163
-
164
-
165
-
166
-
167
-
168
-
169
-
170
-
171
-
172
-
173
-
174
-
175
-
176
-
177
-
178
-
179
-
180
-
181
-
182
-
183
-
184
-
185
-
186
-
187
-
188
-
189
-
190
-
191
-
192
-
193
-
194
-
195
-
196
-
197
-
198
-
199
-
200
-
201
-
202
-
203
-
204
-
205
-
206
-
207
-
208
-
209
-
210
-
211
-
212
-
213
-
214
-
215
-
216
-
217
-
218
-
219
-
220
-
221
-
222
-
223
-
224
-
225
-
226
-
227
-
228
-
229
-
230
-
231
-
232
-
233
-
234
-
235
-
236
 |
 |

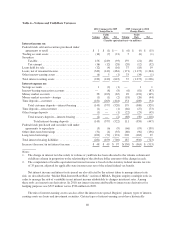
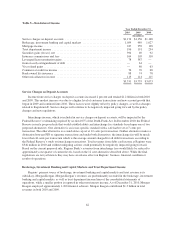
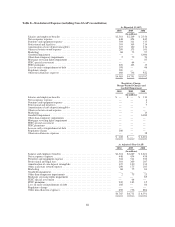
Table 3 “Consolidated Average Daily Balances and Yield/Rate Analysis” presents a detail of net interest
income (on a fully taxable-equivalent basis) the net interest margin, and the net interest spread.
Table 3—Consolidated Average Daily Balances and Yield/Rate Analysis
2010 2009 2008
Average
Balance
Income/
Expense
Yield/
Rate
Average
Balance
Income/
Expense
Yield/
Rate
Average
Balance
Income/
Expense
Yield/
Rate
(Dollars in millions; yields on taxable-equivalent basis)
Assets
Interest-earning assets:
Federal funds sold and securities
purchased under agreements to resell . . $ 694 $ 3 0.43% $ 503 $ 3 0.60% $ 868 $ 18 2.07%
Trading account assets ............... 1,236 44 3.56 1,599 65 4.07 1,473 66 4.48
Securities: .........................
Taxable ......................... 23,854 873 3.66 20,221 966 4.78 16,897 828 4.90
Tax-exempt ...................... 44 1 2.27 460 29 6.30 754 61 8.09
Loans held for sale .................. 1,281 39 3.04 1,655 55 3.32 664 36 5.42
Loans, net of unearned income(1)(2) .... 86,660 3,734 4.31 94,523 4,218 4.46 97,601 5,562 5.70
Other interest-earning assets ........... 5,548 27 0.49 6,927 28 0.40 1,873 29 1.55
Total interest-earning assets ..... 119,317 4,721 3.96 125,888 5,364 4.26 120,130 6,600 5.49
Allowance for loan losses ............... (3,187) (2,240) (1,413)
Cash and due from banks ............... 2,105 2,245 2,522
Other non-earning assets ................ 17,720 16,866 22,708
$135,955 $142,759 $143,947
Liabilities and Stockholders’ Equity
Interest-bearing liabilities:
Savings accounts .................... $ 4,459 4 0.09 $ 3,984 5 0.13 $ 3,744 4 0.11
Interest-bearing transaction accounts .... 14,404 32 0.22 14,347 40 0.28 15,058 127 0.84
Money market accounts .............. 26,753 116 0.43 21,434 181 0.84 18,269 326 1.78
Money market accounts—foreign ....... 601 1 0.17 1,139 3 0.26 2,828 47 1.66
Time deposits—customer ............. 26,236 601 2.29 32,617 1,045 3.20 28,301 1,099 3.88
Total customer deposits—interest-
bearing ........................ 72,453 754 1.04 73,521 1,274 1.73 68,200 1,603 2.35
Time deposits—non customer .......... 54 1 1.85 122 2 1.64 2,083 75 3.60
Other foreign deposits ................ — — — 312 1 0.32 2,074 46 2.22
Total treasury
deposits—interest-bearing ........... 54 1 1.85 434 3 0.69 4,157 121 2.91
Total interest-bearing deposits . . . 72,507 755 1.04 73,955 1,277 1.73 72,357 1,724 2.38
Federal funds purchased and securities
sold under agreements to repurchase . . 2,284 3 0.13 3,166 12 0.38 7,697 171 2.22
Other short-term borrowings ........... 963 7 0.73 5,229 42 0.80 8,704 198 2.27
Long-term borrowings ................ 15,547 492 3.16 18,588 666 3.58 13,510 627 4.64
Total interest-bearing liabilities ........ 91,301 1,257 1.38 100,938 1,997 1.98 102,268 2,720 2.66
Net interest spread ............. 2.58% 2.28% 2.83%
Customer deposits—non-interest-bearing . . . 23,982 20,657 17,720
Other liabilities ....................... 3,228 3,391 4,020
Stockholders' equity ................... 17,444 17,773 19,939
$135,955 $142,759 $143,947
Net interest income/margin on a
taxable-equivalent basis(3) ...... $3,464 2.90% $3,367 2.67% $3,880 3.23%
1. Loans, net of unearned income include non-accrual loans for all periods presented.
2. Interest income includes loan fees of $36 million, $30 million and $50 million for the years ended December 31, 2010,
2009 and 2008, respectively.
3. The computation of taxable-equivalent net interest income is based on the stautory federal income tax rate of 35%,
adjusted for applicable state income taxes net of the related federal tax benefit.
4. Total deposit costs may be calculated by dividing total interest expense on deposits by the sum of interest-bearing
deposits and non-interest bearing deposits. The rates for total deposit costs equal 0.78 percent, 1.35 percent and 1.91
percent for the twelve months ended December 31, 2010, 2009 and 2008, respectively.
59