Regions Bank 2010 Annual Report Download - page 99
Download and view the complete annual report
Please find page 99 of the 2010 Regions Bank annual report below. You can navigate through the pages in the report by either clicking on the pages listed below, or by using the keyword search tool below to find specific information within the annual report.-
 1
1 -
2
-
3
-
4
-
5
-
6
-
7
-
8
-
9
-
10
-
11
-
12
-
13
-
14
-
15
-
16
-
17
-
18
-
19
-
20
-
21
-
22
-
23
-
24
-
25
-
26
-
27
-
28
-
29
-
30
-
31
-
32
-
33
-
34
-
35
-
36
-
37
-
38
-
39
-
40
-
41
-
42
-
43
-
44
-
45
-
46
-
47
-
48
-
49
-
50
-
51
-
52
-
53
-
54
-
55
-
56
-
57
-
58
-
59
-
60
-
61
-
62
-
63
-
64
-
65
-
66
-
67
-
68
-
69
-
70
-
71
-
72
-
73
-
74
-
75
-
76
-
77
-
78
-
79
-
80
-
81
-
82
-
83
-
84
-
85
-
86
-
87
-
88
-
 89
89 -
 90
90 -
 91
91 -
 92
92 -
 93
93 -
 94
94 -
 95
95 -
 96
96 -
 97
97 -
 98
98 -
 99
99 -
 100
100 -
 101
101 -
 102
102 -
 103
103 -
 104
104 -
 105
105 -
 106
106 -
 107
107 -
 108
108 -
 109
109 -
110
-
111
-
112
-
113
-
114
-
115
-
116
-
117
-
118
-
119
-
120
-
121
-
122
-
123
-
124
-
125
-
126
-
127
-
128
-
129
-
130
-
131
-
132
-
133
-
134
-
135
-
136
-
137
-
138
-
139
-
140
-
141
-
142
-
143
-
144
-
145
-
146
-
147
-
148
-
149
-
150
-
151
-
152
-
153
-
154
-
155
-
156
-
157
-
158
-
159
-
160
-
161
-
162
-
163
-
164
-
165
-
166
-
167
-
168
-
169
-
170
-
171
-
172
-
173
-
174
-
175
-
176
-
177
-
178
-
179
-
180
-
181
-
182
-
183
-
184
-
185
-
186
-
187
-
188
-
189
-
190
-
191
-
192
-
193
-
194
-
195
-
196
-
197
-
198
-
199
-
200
-
201
-
202
-
203
-
204
-
205
-
206
-
207
-
208
-
209
-
210
-
211
-
212
-
213
-
214
-
215
-
216
-
217
-
218
-
219
-
220
-
221
-
222
-
223
-
224
-
225
-
226
-
227
-
228
-
229
-
230
-
231
-
232
-
233
-
234
-
235
-
236
 |
 |
BANK REGULATORY CAPITAL REQUIREMENTS
Regions and Regions Bank are required to comply with capital adequacy standards established by banking
regulatory agencies. Currently, there are two basic measures of capital adequacy: a risk-based measure and a
leverage measure.
The risk-based capital standards are designed to make regulatory capital requirements more sensitive to
differences in credit and market risk profiles among banks and bank holding companies, to account for
off-balance sheet exposure and interest rate risk, and to minimize disincentives for holding liquid assets. Assets
and off-balance sheet items are assigned to broad risk categories, each with specified risk-weighting factors. The
resulting capital ratios represent capital as a percentage of total risk-weighted assets and off-balance sheet items.
Banking organizations that are considered to have excessive interest rate risk exposure are required to maintain
higher levels of capital.
The minimum standard for the ratio of total capital to risk-weighted assets is 8 percent. At least 50 percent
of that capital level must consist of common equity, undivided profits and non-cumulative perpetual preferred
stock, senior perpetual preferred stock issued to the U.S. Treasury under the CPP, minority interests relating to
qualifying common or noncumulative perpetual preferred stock issued by a consolidated U.S. depository
institution or foreign bank subsidiary, less goodwill and certain other intangibles (“Tier 1 capital”). The
remainder (“Tier 2 capital”) may consist of a limited amount of other preferred stock, mandatorily convertible
securities, subordinated debt, and a limited amount of the allowance for loan losses. The sum of Tier 1 capital
and Tier 2 capital is “total risk-based capital” or total capital. However, under the Collins Amendment, which
was passed as a section of the Dodd-Frank Act, trust preferred securities will be eliminated as an element of Tier
1 capital. This disallowance of trust preferred securities will be phased in from January 1, 2013 to January 1,
2016. Debt or equity instruments issued to the Federal government as part of the CPP are exempt from the
Collins Amendment. As of December 31, 2010, Regions has $846 million of trust preferred securities that are
subject to the Collins Amendment and $3.5 billion of preferred equity that is exempt from the Collins
Amendment.
The banking regulatory agencies also have adopted regulations that supplement the risk-based guidelines to
include a minimum ratio of 3 percent of Tier 1 capital to average assets less goodwill and disallowed deferred tax
assets (the “Leverage ratio”). Depending upon the risk profile of the institution and other factors, the regulatory
agencies may require a Leverage ratio of 1 percent to 2 percent above the minimum 3 percent level.
In connection with the SCAP, banking regulators began supplementing their assessment of the capital
adequacy of a bank based on a variation of Tier 1 capital, known as Tier 1 common equity. While not codified,
analysts and banking regulators have assessed Regions’ capital adequacy using the tangible common
stockholders’ equity and/or the Tier 1 common equity measure. Because tangible common stockholders’ equity
and Tier 1 common equity are not formally defined by GAAP or codified in the federal banking regulations,
these measures are considered to be non-GAAP financial measures and other entities may calculate them
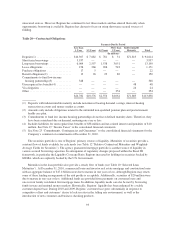
differently than Regions’ disclosed calculations (see Table 2 “GAAP to Non-GAAP Reconciliation” for further
details).
Regions’ Tier 1 common and Tier 1 capital ratios were 7.85 percent and 12.40 percent as of December 31,
2010. Regions is evaluating the anticipated impact of Basel III, which will begin in 2013 and is expected to be
fully phased-in on January 1, 2019 . The Company’s pro forma Tier 1 common and Tier 1 capital ratios, based on
Regions’ current understanding of the guidelines, are approximately 7.62 and 11.35 percent, above the Basel III
minimums of 7 percent for Tier 1 common and 8.5 percent for Tier 1 capital. Regions also expects to meet the
Basel III liquidity coverage ratio in its current form. However, there is still need for clarification of the Basel III
rules as well as interpretation and implementation by U.S. banking regulators, so the ultimate impact on Regions
is not completely known at this point. See the “Supervision and Regulation—Capital Requirements” subsection
of the “Business” section and the “Risk Factors” section of this Annual Report on Form 10-K for more
information.
85