Regions Bank 2010 Annual Report Download - page 190
Download and view the complete annual report
Please find page 190 of the 2010 Regions Bank annual report below. You can navigate through the pages in the report by either clicking on the pages listed below, or by using the keyword search tool below to find specific information within the annual report.-
 1
1 -
2
-
3
-
4
-
5
-
6
-
7
-
8
-
9
-
10
-
11
-
12
-
13
-
14
-
15
-
16
-
17
-
18
-
19
-
20
-
21
-
22
-
23
-
24
-
25
-
26
-
27
-
28
-
29
-
30
-
31
-
32
-
33
-
34
-
35
-
36
-
37
-
38
-
39
-
40
-
41
-
42
-
43
-
44
-
45
-
46
-
47
-
48
-
49
-
50
-
51
-
52
-
53
-
54
-
55
-
56
-
57
-
58
-
59
-
60
-
61
-
62
-
63
-
64
-
65
-
66
-
67
-
68
-
69
-
70
-
71
-
72
-
73
-
74
-
75
-
76
-
77
-
78
-
79
-
80
-
81
-
82
-
83
-
84
-
85
-
86
-
87
-
88
-
89
-
90
-
91
-
92
-
93
-
94
-
95
-
96
-
97
-
98
-
99
-
100
-
101
-
102
-
103
-
104
-
105
-
106
-
107
-
108
-
109
-
110
-
111
-
112
-
113
-
114
-
115
-
116
-
117
-
118
-
119
-
120
-
121
-
122
-
123
-
124
-
125
-
126
-
127
-
128
-
129
-
130
-
131
-
132
-
133
-
134
-
135
-
136
-
137
-
138
-
139
-
140
-
141
-
142
-
143
-
144
-
145
-
146
-
147
-
148
-
149
-
150
-
151
-
152
-
153
-
154
-
155
-
156
-
157
-
158
-
159
-
160
-
161
-
162
-
163
-
164
-
165
-
166
-
167
-
168
-
169
-
170
-
171
-
172
-
173
-
174
-
175
-
176
-
177
-
178
-
179
-
 180
180 -
 181
181 -
 182
182 -
 183
183 -
 184
184 -
 185
185 -
 186
186 -
 187
187 -
 188
188 -
 189
189 -
 190
190 -
 191
191 -
 192
192 -
 193
193 -
 194
194 -
 195
195 -
 196
196 -
 197
197 -
 198
198 -
 199
199 -
 200
200 -
201
-
202
-
203
-
204
-
205
-
206
-
207
-
208
-
209
-
210
-
211
-
212
-
213
-
214
-
215
-
216
-
217
-
218
-
219
-
220
-
221
-
222
-
223
-
224
-
225
-
226
-
227
-
228
-
229
-
230
-
231
-
232
-
233
-
234
-
235
-
236
 |
 |
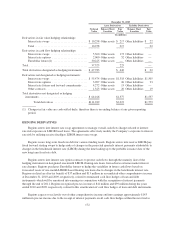
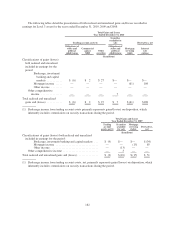
zero recovery. The fair value of sold protection at December 31, 2010 was immaterial. In transactions where
Regions has sold credit protection, recourse to collateral associated with the original swap transaction is available
to offset some or all of Regions’ obligation.
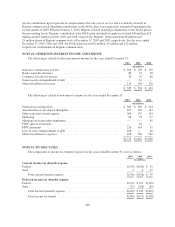
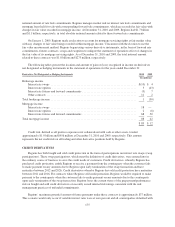
CONTINGENT FEATURES
Certain of Regions Bank’s derivative instrument contracts with broker-dealers contain provisions allowing
those broker-dealers to terminate the contracts in the event that Regions’ and/or Regions Bank’s credit rating
falls below specified ratings from certain major credit rating agencies. During the fourth quarter 2010, Regions
and Regions Bank experienced ratings downgrades from major credit rating agencies. At December 31, 2010,
Moody’s credit ratings for Regions and Regions Bank were below investment grade, and S&P credit ratings for
Regions were below investment grade. As a result of these downgrades, certain of Regions Bank’s broker-dealer
counterparties could have terminated these contracts at their discretion. In lieu of terminating the contracts,
Regions Bank and certain of its broker-dealer counterparties amended the contracts such that Regions Bank was
required to post additional collateral in the cumulative amount of $195 million to theses counterparties.
Some of these contracts with broker-dealers still contain credit-related termination provisions and/or credit-
related provisions regarding the posting of collateral. At December 31, 2010, the net fair value of such contracts
containing credit-related termination provisions that were in a liability position was $446 million, for which
Regions had posted collateral of $591 million. At December 31, 2010, the net fair value of contracts that do not
contain credit-related termination provisions that were in a liability position was $224 million for which Regions
had posted collateral of $219 million. Other derivative contracts with broker-dealers do not contain any credit-
related provisions. These counterparties require complete overnight collateralization.
The aggregate fair value of all derivative instruments with any credit-risk-related contingent features that are
in a liability position on December 31, 2010 and 2009, was $508 million and $261 million, respectively, for
which Regions had posted collateral of $652 million and $247 million, respectively, in the normal course of
business.
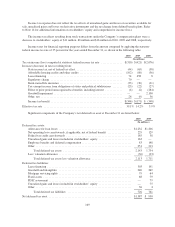
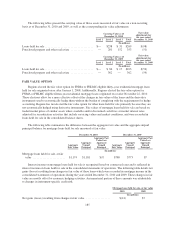
NOTE 21. FAIR VALUE MEASUREMENTS
Fair value guidance establishes a framework for using fair value to measure assets and liabilities and defines
fair value as the price that would be received to sell an asset or paid to transfer a liability (an exit price) as
opposed to the price that would be paid to acquire the asset or received to assume the liability (an entry price). A
fair value measure should reflect the assumptions that market participants would use in pricing the asset or
liability, including the assumptions about the risk inherent in a particular valuation technique, the effect of a
restriction on the sale or use of an asset and the risk of nonperformance. Required disclosures include
stratification of balance sheet amounts measured at fair value based on inputs the Company uses to derive fair
value measurements. These strata include:
• Level 1 valuations, where the valuation is based on quoted market prices for identical assets or
liabilities traded in active markets (which include exchanges and over-the-counter markets with
sufficient volume),
• Level 2 valuations, where the valuation is based on quoted market prices for similar instruments traded
in active markets, quoted prices for identical or similar instruments in markets that are not active and
model-based valuation techniques for which all significant assumptions are observable in the market,
and
• Level 3 valuations, where the valuation is generated from model-based techniques that use significant
assumptions not observable in the market, but observable based on Company-specific data. These
unobservable assumptions reflect the Company’s own estimates for assumptions that market
176