Regions Bank 2010 Annual Report Download - page 192
Download and view the complete annual report
Please find page 192 of the 2010 Regions Bank annual report below. You can navigate through the pages in the report by either clicking on the pages listed below, or by using the keyword search tool below to find specific information within the annual report.-
 1
1 -
2
-
3
-
4
-
5
-
6
-
7
-
8
-
9
-
10
-
11
-
12
-
13
-
14
-
15
-
16
-
17
-
18
-
19
-
20
-
21
-
22
-
23
-
24
-
25
-
26
-
27
-
28
-
29
-
30
-
31
-
32
-
33
-
34
-
35
-
36
-
37
-
38
-
39
-
40
-
41
-
42
-
43
-
44
-
45
-
46
-
47
-
48
-
49
-
50
-
51
-
52
-
53
-
54
-
55
-
56
-
57
-
58
-
59
-
60
-
61
-
62
-
63
-
64
-
65
-
66
-
67
-
68
-
69
-
70
-
71
-
72
-
73
-
74
-
75
-
76
-
77
-
78
-
79
-
80
-
81
-
82
-
83
-
84
-
85
-
86
-
87
-
88
-
89
-
90
-
91
-
92
-
93
-
94
-
95
-
96
-
97
-
98
-
99
-
100
-
101
-
102
-
103
-
104
-
105
-
106
-
107
-
108
-
109
-
110
-
111
-
112
-
113
-
114
-
115
-
116
-
117
-
118
-
119
-
120
-
121
-
122
-
123
-
124
-
125
-
126
-
127
-
128
-
129
-
130
-
131
-
132
-
133
-
134
-
135
-
136
-
137
-
138
-
139
-
140
-
141
-
142
-
143
-
144
-
145
-
146
-
147
-
148
-
149
-
150
-
151
-
152
-
153
-
154
-
155
-
156
-
157
-
158
-
159
-
160
-
161
-
162
-
163
-
164
-
165
-
166
-
167
-
168
-
169
-
170
-
171
-
172
-
173
-
174
-
175
-
176
-
177
-
178
-
179
-
180
-
181
-
 182
182 -
 183
183 -
 184
184 -
 185
185 -
 186
186 -
 187
187 -
 188
188 -
 189
189 -
 190
190 -
 191
191 -
 192
192 -
 193
193 -
 194
194 -
 195
195 -
 196
196 -
 197
197 -
 198
198 -
 199
199 -
 200
200 -
 201
201 -
 202
202 -
203
-
204
-
205
-
206
-
207
-
208
-
209
-
210
-
211
-
212
-
213
-
214
-
215
-
216
-
217
-
218
-
219
-
220
-
221
-
222
-
223
-
224
-
225
-
226
-
227
-
228
-
229
-
230
-
231
-
232
-
233
-
234
-
235
-
236
 |
 |
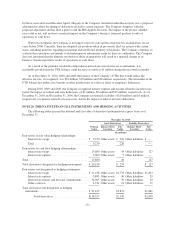
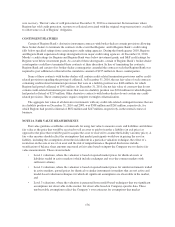
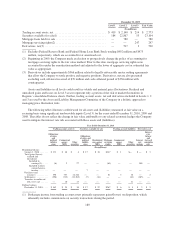
curve, which is consistent with industry standards and conventions. These valuations are adjusted for the
unsecured credit risk at the reporting date, which considers collateral posted and the impact of master netting
agreements. For options and futures contracts traded in over-the-counter markets, values are determined using
discounted cash flow analyses and option pricing models based on market rates and volatilities, or Level 2
measurements. Interest rate lock commitments on loans intended for sale, treasury locks and credit derivatives
are valued using option pricing models that incorporate significant unobservable inputs, and therefore are Level 3
measurements.
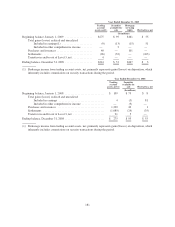
Regions rarely transfers assets and liabilities measured at fair value between Level 1 and Level 2
measurements. There were no such transfers during the years ended December 31, 2010, 2009 or 2008. Trading
account assets are periodically transferred to or from Level 3 valuation based on management’s conclusion
regarding the best method of pricing for an individual security. Such transfers are accounted for as if they occur
at the beginning of a reporting period.
178