Regions Bank 2010 Annual Report Download - page 89
Download and view the complete annual report
Please find page 89 of the 2010 Regions Bank annual report below. You can navigate through the pages in the report by either clicking on the pages listed below, or by using the keyword search tool below to find specific information within the annual report.-
 1
1 -
2
-
3
-
4
-
5
-
6
-
7
-
8
-
9
-
10
-
11
-
12
-
13
-
14
-
15
-
16
-
17
-
18
-
19
-
20
-
21
-
22
-
23
-
24
-
25
-
26
-
27
-
28
-
29
-
30
-
31
-
32
-
33
-
34
-
35
-
36
-
37
-
38
-
39
-
40
-
41
-
42
-
43
-
44
-
45
-
46
-
47
-
48
-
49
-
50
-
51
-
52
-
53
-
54
-
55
-
56
-
57
-
58
-
59
-
60
-
61
-
62
-
63
-
64
-
65
-
66
-
67
-
68
-
69
-
70
-
71
-
72
-
73
-
74
-
75
-
76
-
77
-
78
-
 79
79 -
 80
80 -
 81
81 -
 82
82 -
 83
83 -
 84
84 -
 85
85 -
 86
86 -
 87
87 -
 88
88 -
 89
89 -
 90
90 -
 91
91 -
 92
92 -
 93
93 -
 94
94 -
 95
95 -
 96
96 -
 97
97 -
 98
98 -
 99
99 -
100
-
101
-
102
-
103
-
104
-
105
-
106
-
107
-
108
-
109
-
110
-
111
-
112
-
113
-
114
-
115
-
116
-
117
-
118
-
119
-
120
-
121
-
122
-
123
-
124
-
125
-
126
-
127
-
128
-
129
-
130
-
131
-
132
-
133
-
134
-
135
-
136
-
137
-
138
-
139
-
140
-
141
-
142
-
143
-
144
-
145
-
146
-
147
-
148
-
149
-
150
-
151
-
152
-
153
-
154
-
155
-
156
-
157
-
158
-
159
-
160
-
161
-
162
-
163
-
164
-
165
-
166
-
167
-
168
-
169
-
170
-
171
-
172
-
173
-
174
-
175
-
176
-
177
-
178
-
179
-
180
-
181
-
182
-
183
-
184
-
185
-
186
-
187
-
188
-
189
-
190
-
191
-
192
-
193
-
194
-
195
-
196
-
197
-
198
-
199
-
200
-
201
-
202
-
203
-
204
-
205
-
206
-
207
-
208
-
209
-
210
-
211
-
212
-
213
-
214
-
215
-
216
-
217
-
218
-
219
-
220
-
221
-
222
-
223
-
224
-
225
-
226
-
227
-
228
-
229
-
230
-
231
-
232
-
233
-
234
-
235
-
236
 |
 |

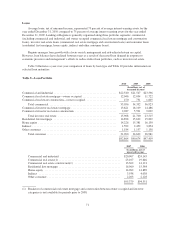
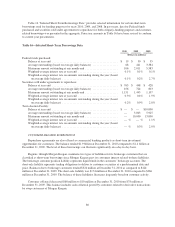
The Company reviews its securities portfolio on a regular basis to determine if there are any conditions
indicating that a security has other-than-temporary impairment. Factors considered in this determination include
the length of time and the extent to which the market value has been below cost, the credit standing of the issuer,
Regions’ intent to sell and whether it is more likely than not that the Company will have to sell the security
before its market value recovers. During 2010, Regions recognized, in earnings, approximately $2 million of
securities impairments, related to equity and other debt securities. During 2009, Regions recognized, in earnings,
approximately $75 million of securities impairments, related primarily to non-agency residential mortgage-
backed securities, equity securities, and a single municipal issuer. See Note 3 “Securities” to the consolidated
financial statements for further details.
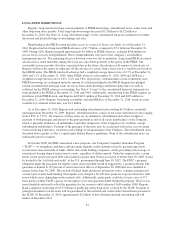
In January 2011, Regions sold approximately $1.5 billion in securities, primarily agency mortgage-backed
securities, and recognized a net pre-tax gain of approximately $52 million.
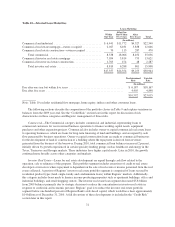
Maturity Analysis—The average life of the securities portfolio (excluding equities) at December 31, 2010
was estimated to be 6.6 years, with a duration of approximately 3.4 years. These metrics compare with an
estimated average life of 3.9 years, with a duration of approximately 1.9 years for the portfolio at December 31,
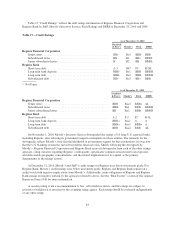
2009. Table 12 “Relative Contractual Maturities and Weighted-Average Yields for Securities” provides
additional details.
Table 12—Relative Contractual Maturities and Weighted-Average Yields for Securities
Securities Maturing
Within
One Year
After One
But Within
Five Years
After Five
But Within
Ten Years
After
Ten Years Total
(Dollars in millions)
Securities:
U.S. Treasury securities ...................... $ 11 $ 80 $ 5 $ — $ 96
Federal agency securities ..................... 3 7 7 4 21
Obligations of states and political subdivisions . . . 2 6 3 19 30
Mortgage-backed securities ...................
Residential agency ...................... — 172 1,412 20,273 21,857
Residential non-agency .................. — — — 22 22
Commercial ........................... — — 54 58 112
Commercial non-agency ................. — 35 15 50 100
Other debt securities ........................ 4 10 2 11 27
$ 20 $ 310 $1,498 $20,437 $22,265
Weighted-average yield ...................... 6.65% 4.06% 3.56% 3.40 % 3.42 %
Notes:
1. The weighted-average yields are calculated on the basis of the yield to maturity based on the book value of
each security. Weighted-average yields on tax-exempt obligations have been computed on a fully taxable-
equivalent basis using a tax rate of 35 percent. Taxable-equivalent adjustments for the calculation of yields
amounted to $0 as of December 31, 2010. Yields on tax-exempt obligations have not been adjusted for the
non-deductible portion of interest expense used to finance the purchase of tax-exempt obligations.
2. Federal Reserve Bank stock, Federal Home Loan Bank stock, and equity stock of other corporations held by
Regions are not included in the table above.
Portfolio Quality—Regions’ investment policy emphasizes credit quality and liquidity. Securities rated in
the highest category by nationally recognized rating agencies and securities backed by the U.S. Government and
government sponsored agencies, both on a direct and indirect basis, represented approximately 99 percent of the
investment portfolio at December 31, 2010. All other securities rated below AAA, not backed by the U.S.
75