Regions Bank 2010 Annual Report Download - page 85
Download and view the complete annual report
Please find page 85 of the 2010 Regions Bank annual report below. You can navigate through the pages in the report by either clicking on the pages listed below, or by using the keyword search tool below to find specific information within the annual report.-
 1
1 -
2
-
3
-
4
-
5
-
6
-
7
-
8
-
9
-
10
-
11
-
12
-
13
-
14
-
15
-
16
-
17
-
18
-
19
-
20
-
21
-
22
-
23
-
24
-
25
-
26
-
27
-
28
-
29
-
30
-
31
-
32
-
33
-
34
-
35
-
36
-
37
-
38
-
39
-
40
-
41
-
42
-
43
-
44
-
45
-
46
-
47
-
48
-
49
-
50
-
51
-
52
-
53
-
54
-
55
-
56
-
57
-
58
-
59
-
60
-
61
-
62
-
63
-
64
-
65
-
66
-
67
-
68
-
69
-
70
-
71
-
72
-
73
-
74
-
 75
75 -
 76
76 -
 77
77 -
 78
78 -
 79
79 -
 80
80 -
 81
81 -
 82
82 -
 83
83 -
 84
84 -
 85
85 -
 86
86 -
 87
87 -
 88
88 -
 89
89 -
 90
90 -
 91
91 -
 92
92 -
 93
93 -
 94
94 -
 95
95 -
96
-
97
-
98
-
99
-
100
-
101
-
102
-
103
-
104
-
105
-
106
-
107
-
108
-
109
-
110
-
111
-
112
-
113
-
114
-
115
-
116
-
117
-
118
-
119
-
120
-
121
-
122
-
123
-
124
-
125
-
126
-
127
-
128
-
129
-
130
-
131
-
132
-
133
-
134
-
135
-
136
-
137
-
138
-
139
-
140
-
141
-
142
-
143
-
144
-
145
-
146
-
147
-
148
-
149
-
150
-
151
-
152
-
153
-
154
-
155
-
156
-
157
-
158
-
159
-
160
-
161
-
162
-
163
-
164
-
165
-
166
-
167
-
168
-
169
-
170
-
171
-
172
-
173
-
174
-
175
-
176
-
177
-
178
-
179
-
180
-
181
-
182
-
183
-
184
-
185
-
186
-
187
-
188
-
189
-
190
-
191
-
192
-
193
-
194
-
195
-
196
-
197
-
198
-
199
-
200
-
201
-
202
-
203
-
204
-
205
-
206
-
207
-
208
-
209
-
210
-
211
-
212
-
213
-
214
-
215
-
216
-
217
-
218
-
219
-
220
-
221
-
222
-
223
-
224
-
225
-
226
-
227
-
228
-
229
-
230
-
231
-
232
-
233
-
234
-
235
-
236
 |
 |

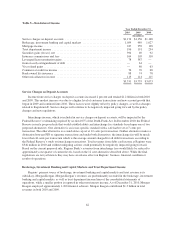
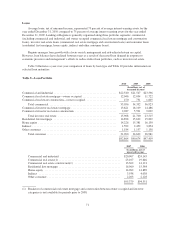
Loans
Average loans, net of unearned income, represented 73 percent of average interest-earning assets for the
year ended December 31, 2010 compared to 75 percent of average interest-earning assets for the year ended
December 31, 2009. Lending at Regions is generally organized along three portfolio segments: commercial
(including commercial and industrial, and owner occupied commercial real estate mortgage and construction
loans), investor real estate loans (commercial real estate mortgage and construction loans) and consumer loans
(residential first mortgage, home equity, indirect and other consumer loans).
Regions manages loan growth with a focus on risk management and risk-adjusted return on capital.
However, loan balances have declined between years as a result of decreased loan demand in response to
economic pressures and management’s efforts to reduce riskier loan portfolios, such as investor real estate.
Table 9 illustrates a year-over-year comparison of loans by loan type and Table 10 provides information on
selected loan maturities.
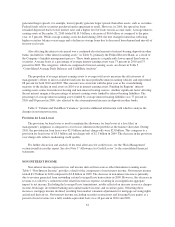
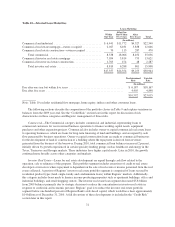
Table 9—Loan Portfolio
2010 2009 2008
(In millions, net of
unearned income)
Commercial and industrial ............................................ $22,540 $21,547 $23,596
Commercial real estate mortgage—owner occupied ........................ 12,046 12,054 11,722
Commercial real estate construction—owner occupied ...................... 470 751 1,605
Total commercial ............................................... 35,056 34,352 36,923
Commercial investor real estate mortgage ................................ 13,621 16,109 14,486
Commercial investor real estate construction ............................. 2,287 5,591 9,029
Total investor real estate ......................................... 15,908 21,700 23,515
Residential first mortgage ............................................ 14,898 15,632 15,839
Home equity ....................................................... 14,226 15,381 16,130
Indirect ........................................................... 1,592 2,452 3,854
Other consumer .................................................... 1,184 1,157 1,158
Total consumer ................................................. 31,900 34,622 36,981
$82,864 $90,674 $97,419
2007 2006
(In millions, net of
unearned income)
Commercial and industrial .......................................... $20,907 $24,145
Commercial real estate(1) ........................................... 23,107 19,646
Commercial real estate construction(1) ................................ 13,302 14,121
Residential first mortgage ........................................... 16,960 15,584
Home equity ..................................................... 14,962 14,889
Indirect ......................................................... 3,938 4,038
Other consumer ................................................... 2,203 2,128
$95,379 $94,551
(1) Breakout of commercial real estate mortgage and construction between owner occupied and investor
categories is not available for periods prior to 2008.
71