Regions Bank 2010 Annual Report Download - page 181
Download and view the complete annual report
Please find page 181 of the 2010 Regions Bank annual report below. You can navigate through the pages in the report by either clicking on the pages listed below, or by using the keyword search tool below to find specific information within the annual report.-
 1
1 -
2
-
3
-
4
-
5
-
6
-
7
-
8
-
9
-
10
-
11
-
12
-
13
-
14
-
15
-
16
-
17
-
18
-
19
-
20
-
21
-
22
-
23
-
24
-
25
-
26
-
27
-
28
-
29
-
30
-
31
-
32
-
33
-
34
-
35
-
36
-
37
-
38
-
39
-
40
-
41
-
42
-
43
-
44
-
45
-
46
-
47
-
48
-
49
-
50
-
51
-
52
-
53
-
54
-
55
-
56
-
57
-
58
-
59
-
60
-
61
-
62
-
63
-
64
-
65
-
66
-
67
-
68
-
69
-
70
-
71
-
72
-
73
-
74
-
75
-
76
-
77
-
78
-
79
-
80
-
81
-
82
-
83
-
84
-
85
-
86
-
87
-
88
-
89
-
90
-
91
-
92
-
93
-
94
-
95
-
96
-
97
-
98
-
99
-
100
-
101
-
102
-
103
-
104
-
105
-
106
-
107
-
108
-
109
-
110
-
111
-
112
-
113
-
114
-
115
-
116
-
117
-
118
-
119
-
120
-
121
-
122
-
123
-
124
-
125
-
126
-
127
-
128
-
129
-
130
-
131
-
132
-
133
-
134
-
135
-
136
-
137
-
138
-
139
-
140
-
141
-
142
-
143
-
144
-
145
-
146
-
147
-
148
-
149
-
150
-
151
-
152
-
153
-
154
-
155
-
156
-
157
-
158
-
159
-
160
-
161
-
162
-
163
-
164
-
165
-
166
-
167
-
168
-
169
-
170
-
 171
171 -
 172
172 -
 173
173 -
 174
174 -
 175
175 -
 176
176 -
 177
177 -
 178
178 -
 179
179 -
 180
180 -
 181
181 -
 182
182 -
 183
183 -
 184
184 -
 185
185 -
 186
186 -
 187
187 -
 188
188 -
 189
189 -
 190
190 -
 191
191 -
192
-
193
-
194
-
195
-
196
-
197
-
198
-
199
-
200
-
201
-
202
-
203
-
204
-
205
-
206
-
207
-
208
-
209
-
210
-
211
-
212
-
213
-
214
-
215
-
216
-
217
-
218
-
219
-
220
-
221
-
222
-
223
-
224
-
225
-
226
-
227
-
228
-
229
-
230
-
231
-
232
-
233
-
234
-
235
-
236
 |
 |

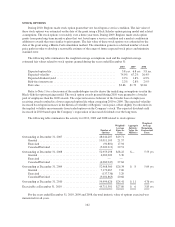
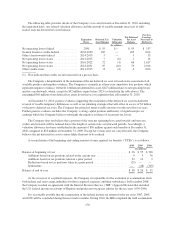
For all investments, quoted market prices of identical assets on active exchanges, or Level 1 measurements,
are used if available. Where such quoted market prices are not available, quoted market prices of similar
instruments (including matrix pricing) and/or discounted cash flows to estimate a value of these securities, or
Level 2 measurements are utilized. Level 2 discounted cash flow analyses are typically based on market interest
rates, prepayment speeds and/or option adjusted spreads. Level 3 measurements are based on assumptions that
are not readily observable in the market place.
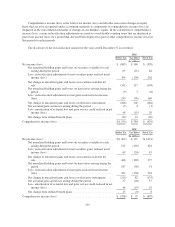
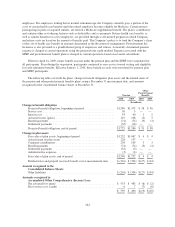
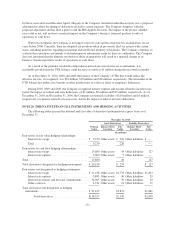
The following table illustrates a rollforward for pension plan financial assets measured at fair value on a
recurring basis using significant unobservable inputs (Level 3) for the years ended December 31 (the other
postretirement plan had no Level 3 financial assets):
Year Ended December 31, 2010
Hedge funds
Real estate
funds
Miscellaneous
assets
(In millions)
Beginning balance, January 1, 2010 .............................. $ 52 $ 56 $ 2
Actual return on plan assets:
Attributable to assets sold during the reporting period ........ — — —
Attributable to assets held at December 31, 2010 ............ 4 (4) —
Purchases, sales, issuances, and settlements, net ................. (2) 50 8
Ending balance, December 31, 2010 .............................. $ 54 $102 $ 10
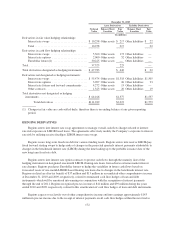
Year Ended December 31, 2009
Hedge funds
Real estate
funds
Miscellaneous
assets
(In millions)
Beginning balance, January 1, 2009 .............................. $78 $ 82 $ 1
Actual return on plan assets:
Attributable to assets sold during the reporting period ........ 2 — —
Attributable to assets held at December 31, 2009 ............ 8 (28) —
Purchases, sales, issuances, and settlements, net ................. (36) 2 1
Ending balance, December 31, 2009 .............................. $52 $ 56 $ 2
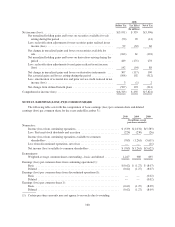
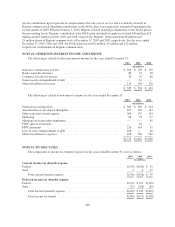
Information about the expected cash flows for the pension plan and other postretirement benefits plans is as
follows:
Year Ended December 31
Pension
Other Postretirement
Benefits
(In millions)
Expected Employer Contributions:
2011 ............................................. $ 9 $ 3
Expected Benefit Payments:
2011 ............................................. $ 82 $ 4
2012 ............................................. 84 4
2013 ............................................. 89 3
2014 ............................................. 96 3
2015 ............................................. 93 2
2016-2020 ........................................ 558 10
OTHER PLANS
Regions has a defined-contribution 401(k) plan that historically included a company match of eligible
employee contributions. Through March 31, 2009, this match totaled 100 percent of the eligible employee
167