Regions Bank 2010 Annual Report Download - page 154
Download and view the complete annual report
Please find page 154 of the 2010 Regions Bank annual report below. You can navigate through the pages in the report by either clicking on the pages listed below, or by using the keyword search tool below to find specific information within the annual report.-
 1
1 -
2
-
3
-
4
-
5
-
6
-
7
-
8
-
9
-
10
-
11
-
12
-
13
-
14
-
15
-
16
-
17
-
18
-
19
-
20
-
21
-
22
-
23
-
24
-
25
-
26
-
27
-
28
-
29
-
30
-
31
-
32
-
33
-
34
-
35
-
36
-
37
-
38
-
39
-
40
-
41
-
42
-
43
-
44
-
45
-
46
-
47
-
48
-
49
-
50
-
51
-
52
-
53
-
54
-
55
-
56
-
57
-
58
-
59
-
60
-
61
-
62
-
63
-
64
-
65
-
66
-
67
-
68
-
69
-
70
-
71
-
72
-
73
-
74
-
75
-
76
-
77
-
78
-
79
-
80
-
81
-
82
-
83
-
84
-
85
-
86
-
87
-
88
-
89
-
90
-
91
-
92
-
93
-
94
-
95
-
96
-
97
-
98
-
99
-
100
-
101
-
102
-
103
-
104
-
105
-
106
-
107
-
108
-
109
-
110
-
111
-
112
-
113
-
114
-
115
-
116
-
117
-
118
-
119
-
120
-
121
-
122
-
123
-
124
-
125
-
126
-
127
-
128
-
129
-
130
-
131
-
132
-
133
-
134
-
135
-
136
-
137
-
138
-
139
-
140
-
141
-
142
-
143
-
 144
144 -
 145
145 -
 146
146 -
 147
147 -
 148
148 -
 149
149 -
 150
150 -
 151
151 -
 152
152 -
 153
153 -
 154
154 -
 155
155 -
 156
156 -
 157
157 -
 158
158 -
 159
159 -
 160
160 -
 161
161 -
 162
162 -
 163
163 -
 164
164 -
165
-
166
-
167
-
168
-
169
-
170
-
171
-
172
-
173
-
174
-
175
-
176
-
177
-
178
-
179
-
180
-
181
-
182
-
183
-
184
-
185
-
186
-
187
-
188
-
189
-
190
-
191
-
192
-
193
-
194
-
195
-
196
-
197
-
198
-
199
-
200
-
201
-
202
-
203
-
204
-
205
-
206
-
207
-
208
-
209
-
210
-
211
-
212
-
213
-
214
-
215
-
216
-
217
-
218
-
219
-
220
-
221
-
222
-
223
-
224
-
225
-
226
-
227
-
228
-
229
-
230
-
231
-
232
-
233
-
234
-
235
-
236
 |
 |

The loan portfolio is diversified geographically, primarily within Alabama, Arkansas, Florida, Georgia,
Illinois, Indiana, Iowa, Kentucky, Louisiana, Mississippi, Missouri, North Carolina, South Carolina, Tennessee,
Texas and Virginia.
During 2009 and 2010, Regions considered its income-producing investor real estate (specifically loans
secured by land, multi-family and retail) and home equity loans secured by second liens in Florida as
concentrations due to continued economic pressures and downturns in the real estate market. Land totaled $1.6
billion at December 31, 2010 as compared to $3.0 billion at December 31, 2009. Multi-family and retail totaled
$7.3 billion at December 31, 2010 as compared to $9.2 billion at December 31, 2009. The credit quality of the
investor real estate portfolio is sensitive to risks associated with construction loans such as cost overruns, project
completion risk, general contractor credit risk, environmental and other hazard risks, and market risks associated
with the sale or rental of completed properties. The portion of the home equity portfolio where the collateral is
comprised of second liens in Florida was $3.2 billion and $3.5 billion at December 31, 2010 and 2009,
respectively.
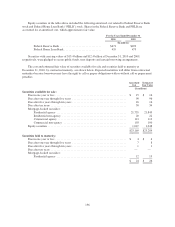
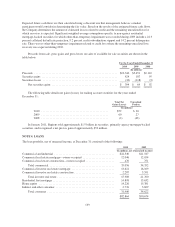
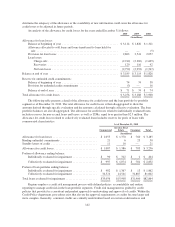
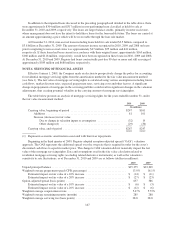
The following table includes certain details related to loans, net of unearned income for the years ended
December 31:
2010 2009
(In millions)
Unearned income ............................................ $1,042 $1,321
Deferred loan costs, net ....................................... 14 56
Unamortized discounts, net .................................... 21 18
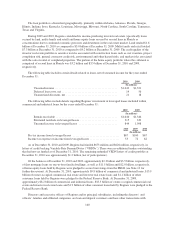
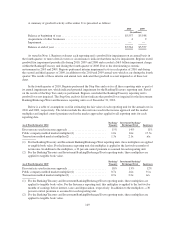
The following tables include details regarding Regions’ investment in leveraged leases included within
commercial and industrial loans for the years ended December 31:
2010 2009
(In millions)
Rentals receivable ........................................... $1,040 $1,346
Estimated residuals on leveraged leases .......................... 315 339
Unearned income on leveraged leases ........................... 844 1,098
2010 2009 2008
(In millions)
Pre-tax income from leveraged leases ................................. $67 $100 $67
Income tax expense on income from leveraged leases ..................... 53 72 62
As of December 31, 2010 and 2009, Regions had funded $673 million and $626 million, respectively, in
letters of credit backing Variable-Rate Demand Notes (“VRDNs”). There were no additional tenders outstanding
that had not yet funded as of December 31, 2010. The remaining unfunded VRDN letters of credit portfolio at
December 31, 2010 was approximately $1.2 billion (net of participations).
Of the balances at December 31, 2010 and 2009, approximately $2.3 billion and $3.5 billion, respectively,
of first mortgage loans on one-to-four family dwellings, as well as $11.5 billion and $12.0 billion, respectively,
of home equity loans held by Regions were pledged to secure borrowings from the FHLB (see Note 12 for
further discussion). At December 31, 2010, approximately $9.8 billion of commercial and industrial loans, $15.9
billion of owner-occupied commercial real estate and investor real estate loans and $1.1 billion of other
consumer loans held by Regions were pledged to the Federal Reserve Bank. At December 31, 2009,
approximately $8.2 billion of commercial and industrial loans, $18.5 billion of owner-occupied commercial real
estate and investor real estate loans and $1.9 billion of other consumer loans held by Regions were pledged to the
Federal Reserve Bank.
Directors and executive officers of Regions and its principal subsidiaries, including the directors’ and
officers’ families and affiliated companies, are loan and deposit customers and have other transactions with
140