Regions Bank 2010 Annual Report Download - page 153
Download and view the complete annual report
Please find page 153 of the 2010 Regions Bank annual report below. You can navigate through the pages in the report by either clicking on the pages listed below, or by using the keyword search tool below to find specific information within the annual report.-
 1
1 -
2
-
3
-
4
-
5
-
6
-
7
-
8
-
9
-
10
-
11
-
12
-
13
-
14
-
15
-
16
-
17
-
18
-
19
-
20
-
21
-
22
-
23
-
24
-
25
-
26
-
27
-
28
-
29
-
30
-
31
-
32
-
33
-
34
-
35
-
36
-
37
-
38
-
39
-
40
-
41
-
42
-
43
-
44
-
45
-
46
-
47
-
48
-
49
-
50
-
51
-
52
-
53
-
54
-
55
-
56
-
57
-
58
-
59
-
60
-
61
-
62
-
63
-
64
-
65
-
66
-
67
-
68
-
69
-
70
-
71
-
72
-
73
-
74
-
75
-
76
-
77
-
78
-
79
-
80
-
81
-
82
-
83
-
84
-
85
-
86
-
87
-
88
-
89
-
90
-
91
-
92
-
93
-
94
-
95
-
96
-
97
-
98
-
99
-
100
-
101
-
102
-
103
-
104
-
105
-
106
-
107
-
108
-
109
-
110
-
111
-
112
-
113
-
114
-
115
-
116
-
117
-
118
-
119
-
120
-
121
-
122
-
123
-
124
-
125
-
126
-
127
-
128
-
129
-
130
-
131
-
132
-
133
-
134
-
135
-
136
-
137
-
138
-
139
-
140
-
141
-
142
-
 143
143 -
 144
144 -
 145
145 -
 146
146 -
 147
147 -
 148
148 -
 149
149 -
 150
150 -
 151
151 -
 152
152 -
 153
153 -
 154
154 -
 155
155 -
 156
156 -
 157
157 -
 158
158 -
 159
159 -
 160
160 -
 161
161 -
 162
162 -
 163
163 -
164
-
165
-
166
-
167
-
168
-
169
-
170
-
171
-
172
-
173
-
174
-
175
-
176
-
177
-
178
-
179
-
180
-
181
-
182
-
183
-
184
-
185
-
186
-
187
-
188
-
189
-
190
-
191
-
192
-
193
-
194
-
195
-
196
-
197
-
198
-
199
-
200
-
201
-
202
-
203
-
204
-
205
-
206
-
207
-
208
-
209
-
210
-
211
-
212
-
213
-
214
-
215
-
216
-
217
-
218
-
219
-
220
-
221
-
222
-
223
-
224
-
225
-
226
-
227
-
228
-
229
-
230
-
231
-
232
-
233
-
234
-
235
-
236
 |
 |

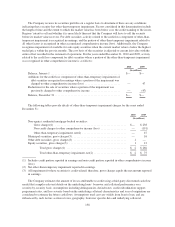
Expected future cash flows are then calculated using a discount rate that management believes a market
participant would consider in determining the fair value. Based on the results of the estimated future cash flows,
the Company determines the amount of estimated losses related to credit and the remaining unrealized loss for
which recovery is expected. Significant weighted-average assumptions specific to non-agency residential
mortgage-backed securities for which other-than-temporary impairment was recorded during 2009 include a 22.9
percent collateral default rate projection, 9.2 percent credit subordination support and 14.2 percent delinquency
rate. There was no other-than-temporary impairment related to credit loss where the remaining unrealized loss
recovery was expected during 2010.
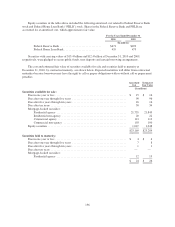
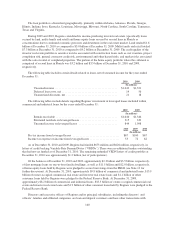
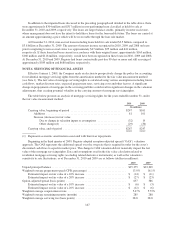
Proceeds from sale, gross gains and gross losses on sales of available for sale securities are shown in the
table below:
For the Years Ended December 31
2010 2009 2008
(In millions)
Proceeds .......................................................... $10,340 $5,451 $2,142
Securities gains ..................................................... 424 187 95
Securities losses .................................................... (30) (118) (3)
Net securities gains .............................................. $ 394 $ 69 $ 92
The following table details net gains (losses) for trading account securities for the years ended
December 31:
Total Net
Gains (Losses)
Unrealized
Portion
(In millions)
2010 ............................................... $52 $30
2009 ............................................... 60 27
2008 ............................................... (2) (43)
In January 2011, Regions sold approximately $1.5 billion in securities, primarily agency mortgage-backed
securities, and recognized a net pre-tax gain of approximately $52 million.
NOTE 4. LOANS
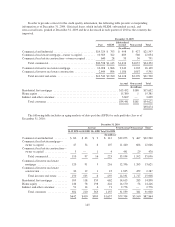
The loan portfolio, net of unearned income, at December 31 consisted of the following:
2010 2009
(In millions, net of unearned income)
Commercial and industrial .......................................... $22,540 $21,547
Commercial real estate mortgage—owner-occupied ...................... 12,046 12,054
Commercial real estate construction—owner-occupied .................... 470 751
Total commercial ............................................. 35,056 34,352
Commercial investor real estate mortgage .............................. 13,621 16,109
Commercial investor real estate construction ............................ 2,287 5,591
Total investor real estate ........................................ 15,908 21,700
Residential first mortgage ........................................... 14,898 15,632
Home equity ..................................................... 14,226 15,381
Indirect and other consumer ......................................... 2,776 3,609
Total consumer ............................................... 31,900 34,622
$82,864 $90,674
139