Regions Bank 2010 Annual Report Download - page 182
Download and view the complete annual report
Please find page 182 of the 2010 Regions Bank annual report below. You can navigate through the pages in the report by either clicking on the pages listed below, or by using the keyword search tool below to find specific information within the annual report.-
 1
1 -
2
-
3
-
4
-
5
-
6
-
7
-
8
-
9
-
10
-
11
-
12
-
13
-
14
-
15
-
16
-
17
-
18
-
19
-
20
-
21
-
22
-
23
-
24
-
25
-
26
-
27
-
28
-
29
-
30
-
31
-
32
-
33
-
34
-
35
-
36
-
37
-
38
-
39
-
40
-
41
-
42
-
43
-
44
-
45
-
46
-
47
-
48
-
49
-
50
-
51
-
52
-
53
-
54
-
55
-
56
-
57
-
58
-
59
-
60
-
61
-
62
-
63
-
64
-
65
-
66
-
67
-
68
-
69
-
70
-
71
-
72
-
73
-
74
-
75
-
76
-
77
-
78
-
79
-
80
-
81
-
82
-
83
-
84
-
85
-
86
-
87
-
88
-
89
-
90
-
91
-
92
-
93
-
94
-
95
-
96
-
97
-
98
-
99
-
100
-
101
-
102
-
103
-
104
-
105
-
106
-
107
-
108
-
109
-
110
-
111
-
112
-
113
-
114
-
115
-
116
-
117
-
118
-
119
-
120
-
121
-
122
-
123
-
124
-
125
-
126
-
127
-
128
-
129
-
130
-
131
-
132
-
133
-
134
-
135
-
136
-
137
-
138
-
139
-
140
-
141
-
142
-
143
-
144
-
145
-
146
-
147
-
148
-
149
-
150
-
151
-
152
-
153
-
154
-
155
-
156
-
157
-
158
-
159
-
160
-
161
-
162
-
163
-
164
-
165
-
166
-
167
-
168
-
169
-
170
-
171
-
 172
172 -
 173
173 -
 174
174 -
 175
175 -
 176
176 -
 177
177 -
 178
178 -
 179
179 -
 180
180 -
 181
181 -
 182
182 -
 183
183 -
 184
184 -
 185
185 -
 186
186 -
 187
187 -
 188
188 -
 189
189 -
 190
190 -
 191
191 -
 192
192 -
193
-
194
-
195
-
196
-
197
-
198
-
199
-
200
-
201
-
202
-
203
-
204
-
205
-
206
-
207
-
208
-
209
-
210
-
211
-
212
-
213
-
214
-
215
-
216
-
217
-
218
-
219
-
220
-
221
-
222
-
223
-
224
-
225
-
226
-
227
-
228
-
229
-
230
-
231
-
232
-
233
-
234
-
235
-
236
 |
 |

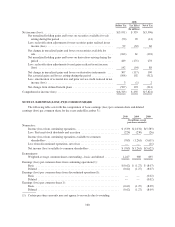
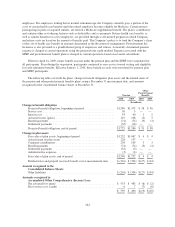
pre-tax contribution (up to 6 percent of compensation) after one year of service and was initially invested in
Regions common stock. Matching contributions in the 401(k) plan were temporarily suspended beginning in the
second quarter of 2009. Effective January 1, 2010, Regions restored matching contributions to the 401(k) plan to
the pre-existing levels. Regions’ contribution to the 401(k) plan on behalf of employees totaled $40 million, $18
million and $55 million in 2010, 2009 and 2008, respectively. Regions’ 401(k) plan held 28 million and
24 million shares of Regions common stock at December 31, 2010 and 2009, respectively. For the years ended
December 31, 2010, 2009 and 2008, the 401(k) plan received $1 million, $5 million and $12 million,
respectively, in dividends on Regions common stock.
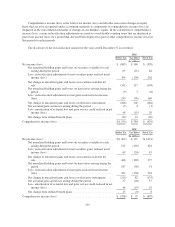
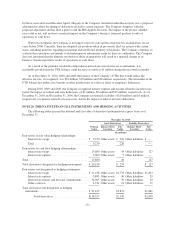
NOTE 18. OTHER NON-INTEREST INCOME AND EXPENSE
The following is a detail of other non-interest income for the years ended December 31:
2010 2009 2008
(In millions)
Insurance commissions and fees .......................................... $ 104 $ 105 $ 110
Bank-owned life insurance ............................................... 88 74 78
Commercial credit fee income ............................................ 76 70 68
Gain on early extinguishment of debt ...................................... — 61 —
Other miscellaneous income ............................................. 115 194 178
$ 383 $ 504 $ 434
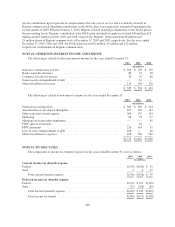
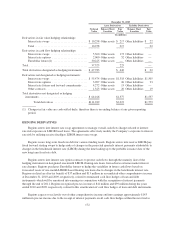
The following is a detail of non-interest expense for the years ended December 31:
2010 2009 2008
(In millions)
Professional and legal fees ............................................... $ 303 $ 309 $ 214
Amortization of core deposit intangibles .................................... 107 120 134
Other real estate owned expense .......................................... 209 175 103
Marketing ............................................................ 68 75 97
Mortgage servicing rights impairment ...................................... — — 85
FDIC special assessment ................................................ — 64 —
FDIC premiums ....................................................... 220 163 15
Loss on early extinguishment of debt ...................................... 108 — 66
Other miscellaneous expenses ............................................ 698 736 922
$1,713 $1,642 $1,636
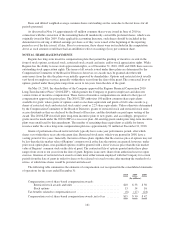
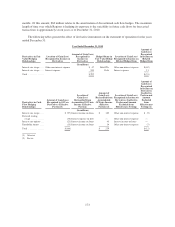
NOTE 19. INCOME TAXES
The components of income tax (benefit) expense for the years ended December 31 were as follows:
2010 2009 2008
(In millions)
Current income tax (benefit) expense
Federal ................................................................. $(140) $(420) $ 32
State ................................................................... 4 4 27
Total current (benefit) expense .......................................... $(136) $(416) $ 59
Deferred income tax (benefit) expense
Federal ................................................................. $(139) $ 351 $(318)
State ................................................................... (71) (106) (89)
Total deferred (benefit) expense ......................................... $(210) $ 245 $(407)
Total income tax benefit ............................................... $(346) $(171) $(348)
168