Regions Bank 2010 Annual Report Download - page 191
Download and view the complete annual report
Please find page 191 of the 2010 Regions Bank annual report below. You can navigate through the pages in the report by either clicking on the pages listed below, or by using the keyword search tool below to find specific information within the annual report.-
 1
1 -
2
-
3
-
4
-
5
-
6
-
7
-
8
-
9
-
10
-
11
-
12
-
13
-
14
-
15
-
16
-
17
-
18
-
19
-
20
-
21
-
22
-
23
-
24
-
25
-
26
-
27
-
28
-
29
-
30
-
31
-
32
-
33
-
34
-
35
-
36
-
37
-
38
-
39
-
40
-
41
-
42
-
43
-
44
-
45
-
46
-
47
-
48
-
49
-
50
-
51
-
52
-
53
-
54
-
55
-
56
-
57
-
58
-
59
-
60
-
61
-
62
-
63
-
64
-
65
-
66
-
67
-
68
-
69
-
70
-
71
-
72
-
73
-
74
-
75
-
76
-
77
-
78
-
79
-
80
-
81
-
82
-
83
-
84
-
85
-
86
-
87
-
88
-
89
-
90
-
91
-
92
-
93
-
94
-
95
-
96
-
97
-
98
-
99
-
100
-
101
-
102
-
103
-
104
-
105
-
106
-
107
-
108
-
109
-
110
-
111
-
112
-
113
-
114
-
115
-
116
-
117
-
118
-
119
-
120
-
121
-
122
-
123
-
124
-
125
-
126
-
127
-
128
-
129
-
130
-
131
-
132
-
133
-
134
-
135
-
136
-
137
-
138
-
139
-
140
-
141
-
142
-
143
-
144
-
145
-
146
-
147
-
148
-
149
-
150
-
151
-
152
-
153
-
154
-
155
-
156
-
157
-
158
-
159
-
160
-
161
-
162
-
163
-
164
-
165
-
166
-
167
-
168
-
169
-
170
-
171
-
172
-
173
-
174
-
175
-
176
-
177
-
178
-
179
-
180
-
 181
181 -
 182
182 -
 183
183 -
 184
184 -
 185
185 -
 186
186 -
 187
187 -
 188
188 -
 189
189 -
 190
190 -
 191
191 -
 192
192 -
 193
193 -
 194
194 -
 195
195 -
 196
196 -
 197
197 -
 198
198 -
 199
199 -
 200
200 -
 201
201 -
202
-
203
-
204
-
205
-
206
-
207
-
208
-
209
-
210
-
211
-
212
-
213
-
214
-
215
-
216
-
217
-
218
-
219
-
220
-
221
-
222
-
223
-
224
-
225
-
226
-
227
-
228
-
229
-
230
-
231
-
232
-
233
-
234
-
235
-
236
 |
 |
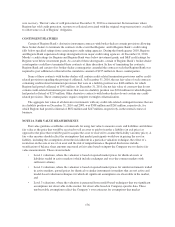
participants would use in pricing the asset or liability. Valuation techniques typically include option
pricing models, discounted cash flow models and similar techniques, but may also include the use of
market prices of assets or liabilities that are not directly comparable to the subject asset or liability.
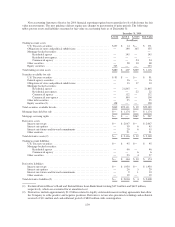
ITEMS MEASURED AT FAIR VALUE ON A RECURRING BASIS
Trading account assets, securities available for sale, certain mortgage loans held for sale, mortgage servicing
rights, derivative assets, trading account liabilities and derivative liabilities were recorded at fair value on a
recurring basis during 2010 and 2009. Below is a description of valuation methodologies for these assets and
liabilities.
Trading account assets and liabilities and securities available for sale consist of U.S. Treasuries,
obligations of states and political subdivisions, mortgage-backed securities (including agency securities), other
securities and equity securities.
• U.S. Treasuries are valued based on quoted market prices of identical assets on active exchanges (Level
1 measurements as described above) and also using data from third-party pricing services for similar
securities as applicable. Pricing from these third party services is generally based on quoted market
prices of similar instruments (including matrix pricing); these valuations are Level 2 measurements.
• Mortgage-backed securities are valued primarily using data from third-party pricing services for similar
securities as applicable. Pricing from these third party services is generally based on quoted market
prices of similar instruments (including matrix pricing); these valuations are Level 2 measurements.
Where such comparable data is not available, the Company develops valuations based on assumptions
that are not readily observable in the market place; these valuations are Level 3 measurements.
• Obligations of states and political subdivisions are generally based on data from third party pricing
services for similar securities (Level 2 measurements as described above). Where such comparable data
is not available, the Company develops valuations based on assumptions that are not readily observable
in the market place; these valuations are Level 3 measurements. For example, auction-rate securities
fall into this category; for these instruments, internal pricing models assume converting the securities
into fixed-rate debt securities with similar credit ratings and maturity dates based on management’s
estimates of the term of the securities. Assumed terms generally fall within a range of one to four years.
• Other securities are valued based on Level 1, 2 and 3 measurements, depending on pricing
methodology selected.
• Equity securities are valued based on quoted market prices of identical assets on active exchanges;
these valuations are Level 1 measurements.
Mortgage loans held for sale consist of residential first mortgage loans held for sale that are valued based
on traded market prices of similar assets where available and/or discounted cash flows at market interest rates,
adjusted for securitization activities that include servicing value and market conditions, a Level 2 measurement.
Regions has elected to measure certain mortgage loans held for sale at fair value by applying the fair value option
(see additional discussion under the “Fair Value Option” section below).
Mortgage servicing rights consist of residential mortgage servicing rights and are valued using an option-
adjusted spread valuation approach, a Level 3 measurement. See Note 6 for information regarding the servicing
of financial assets and additional details regarding the assumptions relevant to this valuation.
Derivative assets and liabilities, which primarily consist of interest rate contracts that include futures,
options and swaps, are included in other assets and other liabilities (as applicable) on the consolidated balance
sheets, and are presented in the 2009 table below as a net amount. Interest rate swaps are predominantly traded in
over-the-counter markets and, as such, values are determined using widely accepted discounted cash flow
models, or Level 2 measurements. These discounted cash flow models use projections of future cash payments/
receipts that are discounted at mid-market rates. The assumed cash flows are sourced from an assumed yield
177