Regions Bank 2010 Annual Report Download - page 202
Download and view the complete annual report
Please find page 202 of the 2010 Regions Bank annual report below. You can navigate through the pages in the report by either clicking on the pages listed below, or by using the keyword search tool below to find specific information within the annual report.-
 1
1 -
2
-
3
-
4
-
5
-
6
-
7
-
8
-
9
-
10
-
11
-
12
-
13
-
14
-
15
-
16
-
17
-
18
-
19
-
20
-
21
-
22
-
23
-
24
-
25
-
26
-
27
-
28
-
29
-
30
-
31
-
32
-
33
-
34
-
35
-
36
-
37
-
38
-
39
-
40
-
41
-
42
-
43
-
44
-
45
-
46
-
47
-
48
-
49
-
50
-
51
-
52
-
53
-
54
-
55
-
56
-
57
-
58
-
59
-
60
-
61
-
62
-
63
-
64
-
65
-
66
-
67
-
68
-
69
-
70
-
71
-
72
-
73
-
74
-
75
-
76
-
77
-
78
-
79
-
80
-
81
-
82
-
83
-
84
-
85
-
86
-
87
-
88
-
89
-
90
-
91
-
92
-
93
-
94
-
95
-
96
-
97
-
98
-
99
-
100
-
101
-
102
-
103
-
104
-
105
-
106
-
107
-
108
-
109
-
110
-
111
-
112
-
113
-
114
-
115
-
116
-
117
-
118
-
119
-
120
-
121
-
122
-
123
-
124
-
125
-
126
-
127
-
128
-
129
-
130
-
131
-
132
-
133
-
134
-
135
-
136
-
137
-
138
-
139
-
140
-
141
-
142
-
143
-
144
-
145
-
146
-
147
-
148
-
149
-
150
-
151
-
152
-
153
-
154
-
155
-
156
-
157
-
158
-
159
-
160
-
161
-
162
-
163
-
164
-
165
-
166
-
167
-
168
-
169
-
170
-
171
-
172
-
173
-
174
-
175
-
176
-
177
-
178
-
179
-
180
-
181
-
182
-
183
-
184
-
185
-
186
-
187
-
188
-
189
-
190
-
191
-
 192
192 -
 193
193 -
 194
194 -
 195
195 -
 196
196 -
 197
197 -
 198
198 -
 199
199 -
 200
200 -
 201
201 -
 202
202 -
 203
203 -
 204
204 -
 205
205 -
 206
206 -
 207
207 -
 208
208 -
 209
209 -
 210
210 -
 211
211 -
 212
212 -
213
-
214
-
215
-
216
-
217
-
218
-
219
-
220
-
221
-
222
-
223
-
224
-
225
-
226
-
227
-
228
-
229
-
230
-
231
-
232
-
233
-
234
-
235
-
236
 |
 |

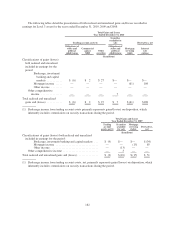
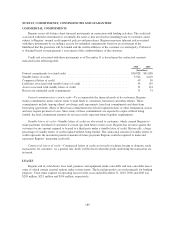
The reportable segment designated Merger Charges and Discontinued Operations includes merger charges
related to the AmSouth acquisition and the results of EquiFirst for 2008. These amounts are excluded from other
reportable segments because management reviews the results of the other reportable segments excluding these
items.
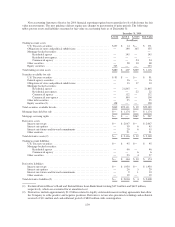
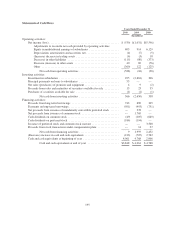
The following tables present financial information for each reportable segment for the years ended
December 31:
December 31, 2010
Banking/
Treasury
Investment
Banking/
Brokerage/
Trust Insurance
Merger
Charges and
Discontinued
Operations
Total
Company
(In millions)
Net interest income ........................... $ 3,364 $ 66 $ 2 $ — $ 3,432
Provision for loan losses ....................... 2,863 — — — 2,863
Non-interest income .......................... 2,184 1,241 106 — 3,531
Non-interest expense ......................... 3,536 1,158 91 — 4,785
Regulatory charge ............................ — 200 — — 200
Income tax (benefit) expense ................... (418) 65 7 — (346)
Net income (loss) ............................ $ (433) $ (116) $ 10 $ — $ (539)
Average assets .............................. $129,639 $5,805 $511 $ — $135,955
December 31, 2009
Banking/
Treasury
Investment
Banking/
Brokerage/
Trust Insurance
Merger
Charges and
Discontinued
Operations
Total
Company
(In millions)
Net interest income ........................... $ 3,273 $ 59 $ 3 $ — $ 3,335
Provision for loan losses ....................... 3,541 — — — 3,541
Non-interest income .......................... 2,439 1,207 109 — 3,755
Non-interest expense ......................... 3,537 1,122 92 — 4,751
Income tax (benefit) expense ................... (232) 53 8 — (171)
Net income (loss) ............................ $ (1,134) $ 91 $ 12 $ — $ (1,031)
Average assets .............................. $137,679 $4,586 $494 $ — $142,759
December 31, 2008
Banking/
Treasury
Investment
Banking/
Brokerage/
Trust Insurance
Merger
Charges and
Discontinued
Operations
Total
Company
(In millions)
Net interest income ........................... $ 3,765 $ 74 $ 4 $ — $ 3,843
Provision for loan losses ....................... 2,057 — — — 2,057
Non-interest income .......................... 1,776 1,183 114 — 3,073
Goodwill impairment ......................... 6,000 — — — 6,000
Non-interest expense ......................... 3,444 1,055 92 219 4,810
Income tax (benefit) expense ................... (355) 74 9 (83) (355)
Net income (loss) ............................ $ (5,605) $ 128 $ 17 $(136) $ (5,596)
Average assets .............................. $139,981 $3,623 $343 $ — $143,947
188