Regions Bank 2010 Annual Report Download - page 209
Download and view the complete annual report
Please find page 209 of the 2010 Regions Bank annual report below. You can navigate through the pages in the report by either clicking on the pages listed below, or by using the keyword search tool below to find specific information within the annual report.-
 1
1 -
2
-
3
-
4
-
5
-
6
-
7
-
8
-
9
-
10
-
11
-
12
-
13
-
14
-
15
-
16
-
17
-
18
-
19
-
20
-
21
-
22
-
23
-
24
-
25
-
26
-
27
-
28
-
29
-
30
-
31
-
32
-
33
-
34
-
35
-
36
-
37
-
38
-
39
-
40
-
41
-
42
-
43
-
44
-
45
-
46
-
47
-
48
-
49
-
50
-
51
-
52
-
53
-
54
-
55
-
56
-
57
-
58
-
59
-
60
-
61
-
62
-
63
-
64
-
65
-
66
-
67
-
68
-
69
-
70
-
71
-
72
-
73
-
74
-
75
-
76
-
77
-
78
-
79
-
80
-
81
-
82
-
83
-
84
-
85
-
86
-
87
-
88
-
89
-
90
-
91
-
92
-
93
-
94
-
95
-
96
-
97
-
98
-
99
-
100
-
101
-
102
-
103
-
104
-
105
-
106
-
107
-
108
-
109
-
110
-
111
-
112
-
113
-
114
-
115
-
116
-
117
-
118
-
119
-
120
-
121
-
122
-
123
-
124
-
125
-
126
-
127
-
128
-
129
-
130
-
131
-
132
-
133
-
134
-
135
-
136
-
137
-
138
-
139
-
140
-
141
-
142
-
143
-
144
-
145
-
146
-
147
-
148
-
149
-
150
-
151
-
152
-
153
-
154
-
155
-
156
-
157
-
158
-
159
-
160
-
161
-
162
-
163
-
164
-
165
-
166
-
167
-
168
-
169
-
170
-
171
-
172
-
173
-
174
-
175
-
176
-
177
-
178
-
179
-
180
-
181
-
182
-
183
-
184
-
185
-
186
-
187
-
188
-
189
-
190
-
191
-
192
-
193
-
194
-
195
-
196
-
197
-
198
-
 199
199 -
 200
200 -
 201
201 -
 202
202 -
 203
203 -
 204
204 -
 205
205 -
 206
206 -
 207
207 -
 208
208 -
 209
209 -
 210
210 -
 211
211 -
 212
212 -
 213
213 -
 214
214 -
 215
215 -
 216
216 -
 217
217 -
 218
218 -
 219
219 -
220
-
221
-
222
-
223
-
224
-
225
-
226
-
227
-
228
-
229
-
230
-
231
-
232
-
233
-
234
-
235
-
236
 |
 |

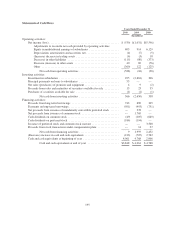
Statements of Cash Flows
Years Ended December 31
2010 2009 2008
(In millions)
Operating activities:
Net income (loss) ................................................. $ (539) $(1,031) $(5,596)
Adjustments to reconcile net cash provided by operating activities:
Equity in undistributed earnings of subsidiaries ..................... 403 914 6,129
Depreciation, amortization and accretion, net ....................... (4) (7) (5)
(Increase) decrease in trading assets .............................. (4) (3) 18
Decrease) in other liabilities .................................... (115) (80) (373)
Decrease (increase) in other assets ............................... 40 69 (76)
Other ...................................................... (369) 122 (125)
Net cash from operating activities ............................ (588) (16) (28)
Investing activities:
Investment in subsidiaries .......................................... 295 (2,681) 306
Principal payments on loans to subsidiaries ............................ 55 — —
Net sales (purchases) of premises and equipment ........................ 4 9 (2)
Proceeds from sales and maturities of securities available for sale .......... 13 23 35
Purchases of securities available for sale .............................. (1) (1) (1)
Net cash from investing activities ............................ 366 (2,650) 338
Financing activities:
Proceeds from long-term borrowings ................................. 743 690 345
Payments on long-term borrowings ................................... (501) (493) (751)
Net proceeds from issuance of mandatorily convertible preferred stock ...... — 278 —
Net proceeds from issuance of common stock .......................... — 1,769 —
Cash dividends on common stock .................................... (49) (105) (669)
Cash dividends on preferred stock ................................... (184) (194) —
Issuance of preferred stock and common stock warrant ................... — — 3,500
Proceeds from stock transactions under compensation plans ............... — 14 27
Net cash from financing activities ............................ 9 1,959 2,452
(Decrease) increase in cash and cash equivalents ........................ (213) (707) 2,762
Cash and cash equivalents at beginning of year ......................... 4,061 4,768 2,006
Cash and cash equivalents at end of year ...................... $3,848 $ 4,061 $ 4,768
195