Regions Bank 2010 Annual Report Download - page 188
Download and view the complete annual report
Please find page 188 of the 2010 Regions Bank annual report below. You can navigate through the pages in the report by either clicking on the pages listed below, or by using the keyword search tool below to find specific information within the annual report.-
 1
1 -
2
-
3
-
4
-
5
-
6
-
7
-
8
-
9
-
10
-
11
-
12
-
13
-
14
-
15
-
16
-
17
-
18
-
19
-
20
-
21
-
22
-
23
-
24
-
25
-
26
-
27
-
28
-
29
-
30
-
31
-
32
-
33
-
34
-
35
-
36
-
37
-
38
-
39
-
40
-
41
-
42
-
43
-
44
-
45
-
46
-
47
-
48
-
49
-
50
-
51
-
52
-
53
-
54
-
55
-
56
-
57
-
58
-
59
-
60
-
61
-
62
-
63
-
64
-
65
-
66
-
67
-
68
-
69
-
70
-
71
-
72
-
73
-
74
-
75
-
76
-
77
-
78
-
79
-
80
-
81
-
82
-
83
-
84
-
85
-
86
-
87
-
88
-
89
-
90
-
91
-
92
-
93
-
94
-
95
-
96
-
97
-
98
-
99
-
100
-
101
-
102
-
103
-
104
-
105
-
106
-
107
-
108
-
109
-
110
-
111
-
112
-
113
-
114
-
115
-
116
-
117
-
118
-
119
-
120
-
121
-
122
-
123
-
124
-
125
-
126
-
127
-
128
-
129
-
130
-
131
-
132
-
133
-
134
-
135
-
136
-
137
-
138
-
139
-
140
-
141
-
142
-
143
-
144
-
145
-
146
-
147
-
148
-
149
-
150
-
151
-
152
-
153
-
154
-
155
-
156
-
157
-
158
-
159
-
160
-
161
-
162
-
163
-
164
-
165
-
166
-
167
-
168
-
169
-
170
-
171
-
172
-
173
-
174
-
175
-
176
-
177
-
 178
178 -
 179
179 -
 180
180 -
 181
181 -
 182
182 -
 183
183 -
 184
184 -
 185
185 -
 186
186 -
 187
187 -
 188
188 -
 189
189 -
 190
190 -
 191
191 -
 192
192 -
 193
193 -
 194
194 -
 195
195 -
 196
196 -
 197
197 -
 198
198 -
199
-
200
-
201
-
202
-
203
-
204
-
205
-
206
-
207
-
208
-
209
-
210
-
211
-
212
-
213
-
214
-
215
-
216
-
217
-
218
-
219
-
220
-
221
-
222
-
223
-
224
-
225
-
226
-
227
-
228
-
229
-
230
-
231
-
232
-
233
-
234
-
235
-
236
 |
 |

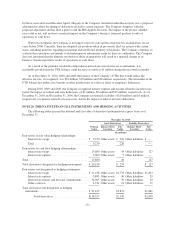
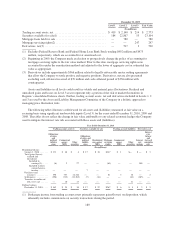
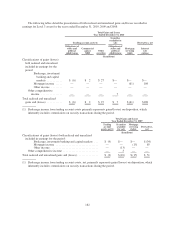
Year Ended December 31, 2009
Derivatives in Fair
Value Hedging
Relationships
Location of Gain(Loss)
Recognized in Income on
Derivatives
Amount of Gain(Loss)
Recognized in
Income on
Derivatives
Hedged Items in
Fair Value Hedge
Relationships
Location of Gain(Loss)
Recognized in Income on
Related Hedged Item
Amount of
Gain(Loss)
Recognized
in Income on
Related
Hedged Item
(In millions)
Interest rate swaps .... Other non-interest expense $(113) Debt/CDs Other non-interest expense $105
Interest rate swaps .... Interest expense 169 Debt Interest expense 4
Total .............. $ 56 $109
Derivatives in Cash
Flow Hedging
Relationships
Amount of Gain(Loss)
Recognized in OCI on
Derivatives
(Effective Portion)(1)
Location of
Gain(Loss)
Reclassified from
Accumulated OCI into
Income
(Effective Portion)
Amount of
Gain(Loss)
Reclassified from
Accumulated
OCI into Income
(Effective
Portion)(2)
Location of Gain(Loss)
Recognized in Income on
Derivatives (Ineffective
Portion and Amount
Excluded from
Effectiveness Testing)
Amount of
Gain(Loss)
Recognized
in Income on
Derivatives
(Ineffective
Portion and
Amount
Excluded
from
Effectiveness
Testing)(2)
(In millions)
Interest rate swaps .... $ (97) Interest income on loans $ 238 Other non-interest expense $ 9
Forward starting
swaps ............ 10 Interest expense on debt — Other non-interest expense —
Interest rate options . . . (29) Interest income on loans 85 Interest income on loans —
Eurodollar futures .... (5)Interest income on loans 30 Other non-interest expense 9
Total .............. $(121) $ 353 $ 18
(1) After-tax
(2) Pre-tax
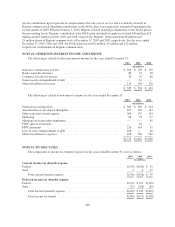
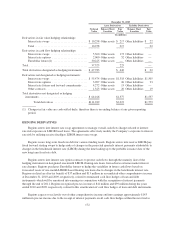
DERIVATIVES NOT DESIGNATED AS HEDGES
The Company maintains a derivatives trading portfolio of interest rate swaps, option contracts, and futures
and forward commitments used to meet the needs of its customers. The portfolio is used to generate trading profit
and to help clients manage market risk. The Company is subject to the credit risk that a counterparty will fail to
perform. The Company is also subject to market risk, which is evaluated by the Company and monitored by the
asset/liability management function. Separate derivative contracts are entered into to reduce overall market
exposure to pre-defined limits. The contracts in this portfolio do not qualify for hedge accounting and are
marked-to-market through earnings and included in other assets and other liabilities.
In the normal course of business, Morgan Keegan enters into underwriting and forward and future
commitments on U.S. Government and municipal securities. As of December 31, 2010 and 2009, the total
notional amount related to forward and future commitments was $312 million and $236 million, respectively.
The brokerage subsidiary typically settles its position by entering into equal but opposite contracts and, as such,
the contract amounts do not necessarily represent future cash requirements. Settlement of the transactions
relating to such commitments is not expected to have a material effect on the subsidiary’s financial position.
Transactions involving future settlement give rise to market risk, which represents the potential loss that can be
caused by a change in the market value of a particular financial instrument. The exposure to market risk is
determined by a number of factors, including size, composition and diversification of positions held, the absolute
and relative levels of interest rates, and market volatility.
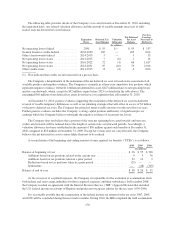
Regions enters into interest rate lock commitments, which are commitments to originate mortgage loans
whereby the interest rate on the loan is determined prior to funding and the customers have locked into that
interest rate. At December 31, 2010 and 2009, Regions had $717 million and $368 million, respectively, in total
174