Regions Bank 2010 Annual Report Download - page 185
Download and view the complete annual report
Please find page 185 of the 2010 Regions Bank annual report below. You can navigate through the pages in the report by either clicking on the pages listed below, or by using the keyword search tool below to find specific information within the annual report.-
 1
1 -
2
-
3
-
4
-
5
-
6
-
7
-
8
-
9
-
10
-
11
-
12
-
13
-
14
-
15
-
16
-
17
-
18
-
19
-
20
-
21
-
22
-
23
-
24
-
25
-
26
-
27
-
28
-
29
-
30
-
31
-
32
-
33
-
34
-
35
-
36
-
37
-
38
-
39
-
40
-
41
-
42
-
43
-
44
-
45
-
46
-
47
-
48
-
49
-
50
-
51
-
52
-
53
-
54
-
55
-
56
-
57
-
58
-
59
-
60
-
61
-
62
-
63
-
64
-
65
-
66
-
67
-
68
-
69
-
70
-
71
-
72
-
73
-
74
-
75
-
76
-
77
-
78
-
79
-
80
-
81
-
82
-
83
-
84
-
85
-
86
-
87
-
88
-
89
-
90
-
91
-
92
-
93
-
94
-
95
-
96
-
97
-
98
-
99
-
100
-
101
-
102
-
103
-
104
-
105
-
106
-
107
-
108
-
109
-
110
-
111
-
112
-
113
-
114
-
115
-
116
-
117
-
118
-
119
-
120
-
121
-
122
-
123
-
124
-
125
-
126
-
127
-
128
-
129
-
130
-
131
-
132
-
133
-
134
-
135
-
136
-
137
-
138
-
139
-
140
-
141
-
142
-
143
-
144
-
145
-
146
-
147
-
148
-
149
-
150
-
151
-
152
-
153
-
154
-
155
-
156
-
157
-
158
-
159
-
160
-
161
-
162
-
163
-
164
-
165
-
166
-
167
-
168
-
169
-
170
-
171
-
172
-
173
-
174
-
 175
175 -
 176
176 -
 177
177 -
 178
178 -
 179
179 -
 180
180 -
 181
181 -
 182
182 -
 183
183 -
 184
184 -
 185
185 -
 186
186 -
 187
187 -
 188
188 -
 189
189 -
 190
190 -
 191
191 -
 192
192 -
 193
193 -
 194
194 -
 195
195 -
196
-
197
-
198
-
199
-
200
-
201
-
202
-
203
-
204
-
205
-
206
-
207
-
208
-
209
-
210
-
211
-
212
-
213
-
214
-
215
-
216
-
217
-
218
-
219
-
220
-
221
-
222
-
223
-
224
-
225
-
226
-
227
-
228
-
229
-
230
-
231
-
232
-
233
-
234
-
235
-
236
 |
 |

for these years and issued Revenue Agent’s Reports to the Company. Included within these reports was a proposed
adjustment to adjust the timing of deductions related to certain expenses. The Company disagrees with this
proposed adjustment and has filed a protest with the IRS Appeals Division. The impact of the protest, whether
successful or not, will not have a material impact on the Company’s business, financial position, results of
operations or cash flows.
With few exceptions, the Company is no longer subject to state and local income tax examinations for tax
years before 2006. Currently, there are disputed tax positions taken in previously filed tax returns with certain
states, including positions regarding investment and intellectual property subsidiaries. The Company continues to
evaluate these positions and intends to defend proposed adjustments made by these tax authorities. The Company
does not anticipate that the ultimate resolution of these examinations will result in a material change to its
business, financial position, results of operations or cash flows.
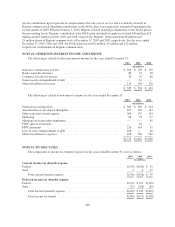
As a result of the potential resolution of the federal and certain state income tax examinations, it is
reasonably possible that the UTB balance could decrease as much as $1 million during the next twelve months.
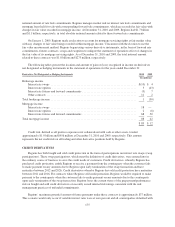
As of December 31, 2010, 2009 and 2008, the balance of the Company’s UTBs that would reduce the
effective tax rate, if recognized, was $24 million, $18 million and $36 million, respectively. The remainder of the
UTB balance has indirect tax benefits in other jurisdictions or is the tax effect of temporary differences.
During 2010, 2009 and 2008, the Company recognized interest expense and income related to income taxes,
before the impact of federal and state deductions, of $2 million, $5 million and $39 million, respectively. As of
December 31, 2010 and December 31, 2009, the Company recognized a liability of $10 million and $5 million,
respectively, for interest related to income taxes, before the impact of federal and state deductions.
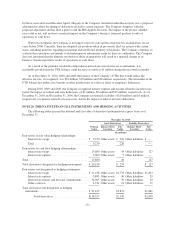
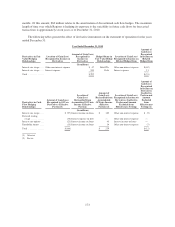
NOTE 20. DERIVATIVE FINANCIAL INSTRUMENTS AND HEDGING ACTIVITIES
The following tables present the notional and fair value of derivative instruments on a gross basis as of
December 31:
December 31, 2010
Asset Derivatives Liability Derivatives
Notional
Value
Balance Sheet
Location
Fair
Value
Balance Sheet
Location
Fair
Value
(In millions)
Derivatives in fair value hedging relationships:
Interest rate swaps .......................... $ 9,230 Other assets $ 226 Other liabilities $ —
Total ..................................... 9,230 226 —
Derivatives in cash flow hedging relationships:
Interest rate swaps .......................... 15,680 Other assets 43 Other liabilities 127
Interest rate options ......................... 2,000 Other assets 5 Other liabilities —
Total ......................................... 17,680 48 127
Total derivatives designated as hedging instruments . . . $ 26,910 $ 274 $ 127
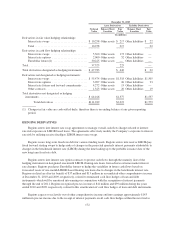
Derivatives not designated as hedging instruments:
Interest rate swaps .......................... $ 51,238 Other assets $1,778 Other liabilities $1,823
Interest rate options ......................... 3,883 Other assets 40 Other liabilities 29
Interest rate futures and forward commitments .... 34,965 Other assets 35 Other liabilities 10
Other contracts ............................. 1,331 Other assets 21 Other liabilities 19
Total derivatives not designated as hedging
instruments .................................. $ 91,417 $1,874 $1,881
Total derivatives ....................... $118,327 $2,148 $2,008
171