Regions Bank 2010 Annual Report Download - page 91
Download and view the complete annual report
Please find page 91 of the 2010 Regions Bank annual report below. You can navigate through the pages in the report by either clicking on the pages listed below, or by using the keyword search tool below to find specific information within the annual report.-
 1
1 -
2
-
3
-
4
-
5
-
6
-
7
-
8
-
9
-
10
-
11
-
12
-
13
-
14
-
15
-
16
-
17
-
18
-
19
-
20
-
21
-
22
-
23
-
24
-
25
-
26
-
27
-
28
-
29
-
30
-
31
-
32
-
33
-
34
-
35
-
36
-
37
-
38
-
39
-
40
-
41
-
42
-
43
-
44
-
45
-
46
-
47
-
48
-
49
-
50
-
51
-
52
-
53
-
54
-
55
-
56
-
57
-
58
-
59
-
60
-
61
-
62
-
63
-
64
-
65
-
66
-
67
-
68
-
69
-
70
-
71
-
72
-
73
-
74
-
75
-
76
-
77
-
78
-
79
-
80
-
 81
81 -
 82
82 -
 83
83 -
 84
84 -
 85
85 -
 86
86 -
 87
87 -
 88
88 -
 89
89 -
 90
90 -
 91
91 -
 92
92 -
 93
93 -
 94
94 -
 95
95 -
 96
96 -
 97
97 -
 98
98 -
 99
99 -
 100
100 -
 101
101 -
102
-
103
-
104
-
105
-
106
-
107
-
108
-
109
-
110
-
111
-
112
-
113
-
114
-
115
-
116
-
117
-
118
-
119
-
120
-
121
-
122
-
123
-
124
-
125
-
126
-
127
-
128
-
129
-
130
-
131
-
132
-
133
-
134
-
135
-
136
-
137
-
138
-
139
-
140
-
141
-
142
-
143
-
144
-
145
-
146
-
147
-
148
-
149
-
150
-
151
-
152
-
153
-
154
-
155
-
156
-
157
-
158
-
159
-
160
-
161
-
162
-
163
-
164
-
165
-
166
-
167
-
168
-
169
-
170
-
171
-
172
-
173
-
174
-
175
-
176
-
177
-
178
-
179
-
180
-
181
-
182
-
183
-
184
-
185
-
186
-
187
-
188
-
189
-
190
-
191
-
192
-
193
-
194
-
195
-
196
-
197
-
198
-
199
-
200
-
201
-
202
-
203
-
204
-
205
-
206
-
207
-
208
-
209
-
210
-
211
-
212
-
213
-
214
-
215
-
216
-
217
-
218
-
219
-
220
-
221
-
222
-
223
-
224
-
225
-
226
-
227
-
228
-
229
-
230
-
231
-
232
-
233
-
234
-
235
-
236
 |
 |
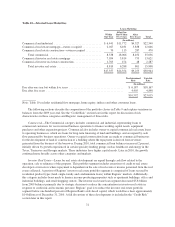
Mortgage Servicing Rights
Mortgage servicing rights at December 31, 2010 totaled $267 million compared to $247 million at
December 31, 2009. A summary of mortgage servicing rights is presented in Note 6 “Servicing of Financial
Assets” to the consolidated financial statements. The balances shown represent the right to service mortgage
loans that are owned by other investors. Mortgage servicing rights are presented at fair value as of December 31,
2010 and 2009.
On January 1, 2009, Regions began accounting for mortgage servicing rights at fair market value with any
changes to fair value being recorded within mortgage income. Also, in early 2009, Regions entered into
derivative and trading asset transactions to mitigate the impact of market value fluctuations related to mortgage
servicing rights. However, derivative instruments entered into in the future could be materially different from the
current risk profile of Regions’ current portfolio. See the “Mortgage Income” section earlier in this report for
detail regarding the effect of mortgage servicing rights and related hedging items on Regions’ consolidated
statement of operations.
Other Identifiable Intangible Assets
Other identifiable intangible assets, consisting primarily of core deposit intangibles, totaled $385 million at
December 31, 2010 compared to $503 million at December 31, 2009. The year-over-year decline is mainly the
result of amortization. Regions noted no indicators of impairment for any other identifiable intangible assets. See
Note 8 “Intangible Assets” to the consolidated financial statements for further information.
Other Assets
Other assets increased $1.5 billion to $9.4 billion as of December 31, 2010. Securities sold but not yet
settled near the end of 2010 primarily drove the increase. Net deferred income tax assets also contributed to the
year-over-year increase, a portion of which resulted from sales of available for sale securities, which previously
carried a deferred tax liability related to their unrealized gain. The increases were partially offset by amortization
of prepaid FDIC premiums and reduced foreclosed properties balances.
DEPOSITS
Regions competes with other banking and financial services companies for a share of the deposit market.
Regions’ ability to compete in the deposit market depends heavily on the pricing of its deposits and how
effectively the Company meets customers’ needs. Regions employs various means to meet those needs and
enhance competitiveness, such as providing a high level of customer service, competitive pricing and providing
convenient branch locations for its customers. Regions also serves customers through providing centralized,
high-quality banking services and alternative product delivery channels such as internet banking.
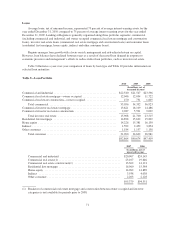
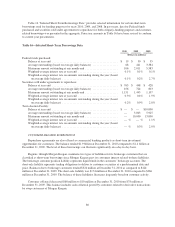
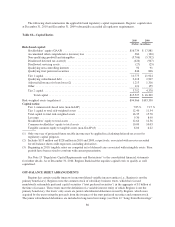
Deposits are Regions’ primary source of funds, providing funding for 81 percent of average interest-earning
assets in 2010 and 75 percent of average interest-earning assets in 2009. Table 14 “Deposits” details year-over-
year deposits on a period-ending basis. Total deposits as of year-end 2010 decreased $4.1 billion, or 4 percent,
compared to year-end 2009. The overall decrease in deposits was primarily driven by decreases in customer time
deposit accounts as a result of maturities. These decreases were partially offset by increases in domestic money
market accounts. There has also been a shift from interest-bearing transaction accounts to non-interest-bearing
demand accounts during the year. Regions continues to deepen and retain existing customer relationships, as well
as develop new relationships through client acquisition, new checking products and money market rate offers.
Customer deposits, which are total deposits excluding deposits used for wholesale funding purposes,
decreased by 4 percent to $94.6 billion on an ending basis during 2010. Decreases in customer time deposit
accounts were the main source of decline. Growth in domestic money market accounts offset the decline. In
2008, the banking industry experienced very high deposit pricing due to liquidity concerns thereby accentuating
pricing pressure on Regions and the industry as a whole. However, in 2009 and continuing into 2010, due to
77