Regions Bank 2010 Annual Report Download - page 56
Download and view the complete annual report
Please find page 56 of the 2010 Regions Bank annual report below. You can navigate through the pages in the report by either clicking on the pages listed below, or by using the keyword search tool below to find specific information within the annual report.-
 1
1 -
2
-
3
-
4
-
5
-
6
-
7
-
8
-
9
-
10
-
11
-
12
-
13
-
14
-
15
-
16
-
17
-
18
-
19
-
20
-
21
-
22
-
23
-
24
-
25
-
26
-
27
-
28
-
29
-
30
-
31
-
32
-
33
-
34
-
35
-
36
-
37
-
38
-
39
-
40
-
41
-
42
-
43
-
44
-
45
-
 46
46 -
 47
47 -
 48
48 -
 49
49 -
 50
50 -
 51
51 -
 52
52 -
 53
53 -
 54
54 -
 55
55 -
 56
56 -
 57
57 -
 58
58 -
 59
59 -
 60
60 -
 61
61 -
 62
62 -
 63
63 -
 64
64 -
 65
65 -
 66
66 -
67
-
68
-
69
-
70
-
71
-
72
-
73
-
74
-
75
-
76
-
77
-
78
-
79
-
80
-
81
-
82
-
83
-
84
-
85
-
86
-
87
-
88
-
89
-
90
-
91
-
92
-
93
-
94
-
95
-
96
-
97
-
98
-
99
-
100
-
101
-
102
-
103
-
104
-
105
-
106
-
107
-
108
-
109
-
110
-
111
-
112
-
113
-
114
-
115
-
116
-
117
-
118
-
119
-
120
-
121
-
122
-
123
-
124
-
125
-
126
-
127
-
128
-
129
-
130
-
131
-
132
-
133
-
134
-
135
-
136
-
137
-
138
-
139
-
140
-
141
-
142
-
143
-
144
-
145
-
146
-
147
-
148
-
149
-
150
-
151
-
152
-
153
-
154
-
155
-
156
-
157
-
158
-
159
-
160
-
161
-
162
-
163
-
164
-
165
-
166
-
167
-
168
-
169
-
170
-
171
-
172
-
173
-
174
-
175
-
176
-
177
-
178
-
179
-
180
-
181
-
182
-
183
-
184
-
185
-
186
-
187
-
188
-
189
-
190
-
191
-
192
-
193
-
194
-
195
-
196
-
197
-
198
-
199
-
200
-
201
-
202
-
203
-
204
-
205
-
206
-
207
-
208
-
209
-
210
-
211
-
212
-
213
-
214
-
215
-
216
-
217
-
218
-
219
-
220
-
221
-
222
-
223
-
224
-
225
-
226
-
227
-
228
-
229
-
230
-
231
-
232
-
233
-
234
-
235
-
236
 |
 |
Company’s liquidity position is solid and appropriate. For more information, refer to the following
additional sections within this Form 10-K:
• Discussion of Short-Term Borrowings within the Balance Sheet Analysis section of MD&A
• Discussion of Long-Term Borrowings within the Balance Sheet Analysis section of MD&A
• Ratings section of MD&A
• Liquidity Risk section of MD&A
• Note 11 “Short-Term Borrowings” to the consolidated financial statements
• Note 12 “Long-Term Borrowings” to the consolidated financial statements
• Note 23 “Commitments, Contingencies and Guarantees” to the consolidated financial statements
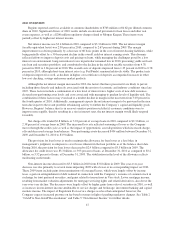
• Interest Rate Risk—In the fourth quarter of 2010, the net interest margin expanded to 3.00 percent,
largely due to a mix shift from time deposits to lower cost deposit products. Deposit costs decreased
from 1.35 percent in 2009 to 0.78 percent in 2010, and stood at 0.64 percent for the fourth quarter of
2010. However, the margin continues to be negatively affected by a persistently low interest rate
environment, non-performing asset levels, and maintenance of conservative balance sheet liquidity
levels. Additionally, management expects the net interest margin to be pressured in the near term due
in part to the recent portfolio rebalancing activity undertaken to further the Company’s capital and
liquidity goals. Over the longer term, the eventual rise of benchmark interest rates will have a favorable
impact on the net interest margin. The Company entered into an additional series of interest rate swaps
to mitigate the risk to interest income if rates continue to remain low in the near term. These swaps
offer this protection while reducing asset sensitivity through 2012. Management's 2009 decision to
de-risk the securities portfolio also impacts the net interest margin. At December 31, 2010, the
securities portfolio almost exclusively consisted of agency guaranteed residential mortgage-backed
securities. Management expects to achieve a higher margin over the long term as excess liquidity is
reinvested, the securities portfolio is repositioned, disciplined loan pricing is emphasized, the
composition of the loan portfolio is migrated toward more consumer products and an advantageous
deposit mix is maintained. For more information, refer to the following additional sections within this
Form 10-K:
• 2010 Overview discussion in MD&A
• Net Interest Income and Margin section of MD&A
• Interest Rate Risk section of MD&A
• Regulatory Capital—Regions’ ability to maintain appropriate levels of capital is critical to its safety
and soundness. At December 31, 2010, Regions’ Tier 1 capital and Tier 1 common ratios were 12.40
percent and 7.85 percent, respectively. On a Basel III pro forma basis, the corresponding Basel III
ratios, based on Regions’ current understanding of the guidelines, are 7.62 percent and 11.35 percent,
respectively, above the respective Basel III minimums of 7 percent and 8.5 percent. Regions’ capital
planning process is executed by management, overseen by the Board of Directors, and supervised by
banking regulators. The process utilizes a base case, multiple adverse cases and a growth forecast. For
more information, refer to the following additional sections within this Form 10-K:
• 2010 Overview discussion in MD&A
• Bank Regulatory Capital Requirements section of MD&A
• Note 13 “Regulatory Capital Requirements and Restrictions” to the consolidated financial
statements
42