Regions Bank 2010 Annual Report Download - page 193
Download and view the complete annual report
Please find page 193 of the 2010 Regions Bank annual report below. You can navigate through the pages in the report by either clicking on the pages listed below, or by using the keyword search tool below to find specific information within the annual report.-
 1
1 -
2
-
3
-
4
-
5
-
6
-
7
-
8
-
9
-
10
-
11
-
12
-
13
-
14
-
15
-
16
-
17
-
18
-
19
-
20
-
21
-
22
-
23
-
24
-
25
-
26
-
27
-
28
-
29
-
30
-
31
-
32
-
33
-
34
-
35
-
36
-
37
-
38
-
39
-
40
-
41
-
42
-
43
-
44
-
45
-
46
-
47
-
48
-
49
-
50
-
51
-
52
-
53
-
54
-
55
-
56
-
57
-
58
-
59
-
60
-
61
-
62
-
63
-
64
-
65
-
66
-
67
-
68
-
69
-
70
-
71
-
72
-
73
-
74
-
75
-
76
-
77
-
78
-
79
-
80
-
81
-
82
-
83
-
84
-
85
-
86
-
87
-
88
-
89
-
90
-
91
-
92
-
93
-
94
-
95
-
96
-
97
-
98
-
99
-
100
-
101
-
102
-
103
-
104
-
105
-
106
-
107
-
108
-
109
-
110
-
111
-
112
-
113
-
114
-
115
-
116
-
117
-
118
-
119
-
120
-
121
-
122
-
123
-
124
-
125
-
126
-
127
-
128
-
129
-
130
-
131
-
132
-
133
-
134
-
135
-
136
-
137
-
138
-
139
-
140
-
141
-
142
-
143
-
144
-
145
-
146
-
147
-
148
-
149
-
150
-
151
-
152
-
153
-
154
-
155
-
156
-
157
-
158
-
159
-
160
-
161
-
162
-
163
-
164
-
165
-
166
-
167
-
168
-
169
-
170
-
171
-
172
-
173
-
174
-
175
-
176
-
177
-
178
-
179
-
180
-
181
-
182
-
 183
183 -
 184
184 -
 185
185 -
 186
186 -
 187
187 -
 188
188 -
 189
189 -
 190
190 -
 191
191 -
 192
192 -
 193
193 -
 194
194 -
 195
195 -
 196
196 -
 197
197 -
 198
198 -
 199
199 -
 200
200 -
 201
201 -
 202
202 -
 203
203 -
204
-
205
-
206
-
207
-
208
-
209
-
210
-
211
-
212
-
213
-
214
-
215
-
216
-
217
-
218
-
219
-
220
-
221
-
222
-
223
-
224
-
225
-
226
-
227
-
228
-
229
-
230
-
231
-
232
-
233
-
234
-
235
-
236
 |
 |

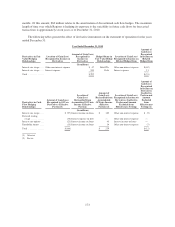
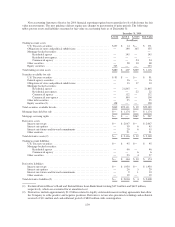
New accounting literature effective for 2010 financial reporting required more granular levels of disclosure for fair
value measurements. The new guidance did not require any changes to presentation of prior periods. The following
tables present assets and liabilities measured at fair value on a recurring basis as of December 31:
December 31, 2010
Level 1 Level 2 Level 3 Fair Value
(In millions)
Trading account assets
U.S. Treasury securities ........................................... $157 $ 14 $— $ 171
Obligations of states and political subdivisions ......................... — 190 165 355
Mortgage-backed securities: ........................................ —
Residential agency ........................................... — 145 — 145
Residential non-agency ........................................ — — — —
Commercial agency .......................................... — — 54 54
Other securities .................................................. — 58 10 68
Equity securities ................................................. 323 — — 323
Total trading account assets ............................................ $480 $ 407 $229 $ 1,116
Securities available for sale
U.S. Treasury securities ........................................... $ 91 $ — $— $ 91
Federal agency securities .......................................... — 16 — 16
Obligations of states and political subdivisions ......................... — 13 17 30
Mortgage-backed securities:
Residential agency ........................................... — 21,845 — 21,845
Residential non-agency ........................................ — — 22 22
Commercial agency .......................................... — 112 — 112
Commercial non-agency ....................................... — 100 — 100
Other debt securities .............................................. — 25 — 25
Equity securities(1) ............................................... 158 — — 158
Total securities available for sale ........................................ $249 $22,111 $ 39 $22,399
Mortgage loans held for sale ........................................... $— $ 1,174 $— $ 1,174
Mortgage servicing rights .............................................. $— $ — $267 $ 267
Derivative assets
Interest rate swaps ............................................... $— $ 2,047 $— $ 2,047
Interest rate options .............................................. — 39 6 45
Interest rate futures and forward commitments ......................... — 29 6 35
Other contracts .................................................. — 21 — 21
Total derivative assets(2) .............................................. $— $ 2,136 $ 12 $ 2,148
Trading account liabilities
U.S. Treasury securities ........................................... $— $ 95 $— $ 95
Mortgage-backed securities:
Residential agency ........................................... — 46 — 46
Commercial agency .......................................... — — 6 6
Other securities .................................................. — 23 4 27
$— $ 164 $ 10 $ 174
Derivative liabilities
Interest rate swaps ............................................... $— $ 1,950 $— $ 1,950
Interest rate options .............................................. — 26 3 29
Interest rate futures and forward commitments ......................... — 9 1 10
Other contracts .................................................. — 19 — 19
Total derivative liabilities(2) ........................................... $— $ 2,004 $ 4 $ 2,008
(1) Excludes Federal Reserve Bank and Federal Home Loan Bank Stock totaling $471 million and $419 million,
respectively, which are accounted for at amortized cost.
(2) Derivatives include approximately $1.0 billion related to legally enforceable master netting agreements that allow
the Company to settle positive and negative positions. Derivatives, net are also presented excluding cash collateral
received of $11 million and cash collateral posted of $810 million with counterparties.
179