Regions Bank 2010 Annual Report Download - page 145
Download and view the complete annual report
Please find page 145 of the 2010 Regions Bank annual report below. You can navigate through the pages in the report by either clicking on the pages listed below, or by using the keyword search tool below to find specific information within the annual report.-
 1
1 -
2
-
3
-
4
-
5
-
6
-
7
-
8
-
9
-
10
-
11
-
12
-
13
-
14
-
15
-
16
-
17
-
18
-
19
-
20
-
21
-
22
-
23
-
24
-
25
-
26
-
27
-
28
-
29
-
30
-
31
-
32
-
33
-
34
-
35
-
36
-
37
-
38
-
39
-
40
-
41
-
42
-
43
-
44
-
45
-
46
-
47
-
48
-
49
-
50
-
51
-
52
-
53
-
54
-
55
-
56
-
57
-
58
-
59
-
60
-
61
-
62
-
63
-
64
-
65
-
66
-
67
-
68
-
69
-
70
-
71
-
72
-
73
-
74
-
75
-
76
-
77
-
78
-
79
-
80
-
81
-
82
-
83
-
84
-
85
-
86
-
87
-
88
-
89
-
90
-
91
-
92
-
93
-
94
-
95
-
96
-
97
-
98
-
99
-
100
-
101
-
102
-
103
-
104
-
105
-
106
-
107
-
108
-
109
-
110
-
111
-
112
-
113
-
114
-
115
-
116
-
117
-
118
-
119
-
120
-
121
-
122
-
123
-
124
-
125
-
126
-
127
-
128
-
129
-
130
-
131
-
132
-
133
-
134
-
 135
135 -
 136
136 -
 137
137 -
 138
138 -
 139
139 -
 140
140 -
 141
141 -
 142
142 -
 143
143 -
 144
144 -
 145
145 -
 146
146 -
 147
147 -
 148
148 -
 149
149 -
 150
150 -
 151
151 -
 152
152 -
 153
153 -
 154
154 -
 155
155 -
156
-
157
-
158
-
159
-
160
-
161
-
162
-
163
-
164
-
165
-
166
-
167
-
168
-
169
-
170
-
171
-
172
-
173
-
174
-
175
-
176
-
177
-
178
-
179
-
180
-
181
-
182
-
183
-
184
-
185
-
186
-
187
-
188
-
189
-
190
-
191
-
192
-
193
-
194
-
195
-
196
-
197
-
198
-
199
-
200
-
201
-
202
-
203
-
204
-
205
-
206
-
207
-
208
-
209
-
210
-
211
-
212
-
213
-
214
-
215
-
216
-
217
-
218
-
219
-
220
-
221
-
222
-
223
-
224
-
225
-
226
-
227
-
228
-
229
-
230
-
231
-
232
-
233
-
234
-
235
-
236
 |
 |
and stock performance awards if dilutive. The diluted earnings (loss) per common share computation also
assumes conversion of any outstanding convertible preferred stock and warrants, unless such an assumed
conversion would be antidilutive.
FAIR VALUE MEASUREMENTS
Fair value guidance establishes a framework for using fair value to measure assets and liabilities and defines
fair value as the price that would be received to sell an asset or paid to transfer a liability (an exit price) as
opposed to the price that would be paid to acquire the asset or received to assume the liability (an entry price). A
fair value measure should reflect the assumptions that market participants would use in pricing the asset or
liability, including the assumptions about the risk inherent in a particular valuation technique, the effect of a
restriction on the sale or use of an asset and the risk of nonperformance. Required disclosures include
stratification of balance sheet amounts measured at fair value based on inputs the company uses to derive fair
value measurements. These strata include:
• Level 1 valuations, where the valuation is based on quoted market prices for identical assets or
liabilities traded in active markets (which include exchanges and over-the-counter markets with
sufficient volume),
• Level 2 valuations, where the valuation is based on quoted market prices for similar instruments traded
in active markets, quoted prices for identical or similar instruments in markets that are not active and
model-based valuation techniques for which all significant assumptions are observable in the market,
and
• Level 3 valuations, where the valuation is generated from model-based techniques that use significant
assumptions not observable in the market, but observable based on Company-specific data. These
unobservable assumptions reflect the Company’s own estimates for assumptions that market
participants would use in pricing the asset or liability. Valuation techniques typically include option
pricing models, discounted cash flow models and similar techniques, but may also include the use of
market prices of assets or liabilities that are not directly comparable to the subject asset or liability.
See Note 21 for additional information related to fair value measurements.
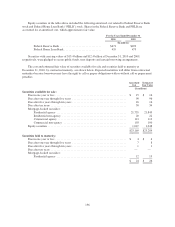
DISCONTINUED OPERATIONS
As a result of the sale of EquiFirst Corporation (“EquiFirst”), a wholly owned non-conforming mortgage
origination subsidiary, on March 30, 2007, the business related to EquiFirst has been accounted for as
discontinued operations with the results presented separately on the consolidated statements of operations.
Regions recognized a loss from discontinued operations, net of tax, in the amount of $11 million for the year
ending December 31, 2008. The results from discontinued operations did not impact the years ending
December 31, 2010 or 2009.
RECENT ACCOUNTING PRONOUNCEMENTS AND ACCOUNTING CHANGES
In January 2009, the FASB issued guidance amending impairment guidance relating to purchased beneficial
interests and beneficial interests that are held by a transferor in securitized financial assets. The amended
guidance aims to provide a more consistent determination of whether an other-than-temporary impairment has
occurred. Additionally, the guidance retains and emphasizes the objective of an other-than-temporary impairment
assessment and the related disclosure requirements for certain debt and equity securities. This guidance is
effective for interim and annual reporting periods ending after December 15, 2008, and is applied prospectively.
Regions adopted this guidance as of December 31, 2008, and the effect of adoption on the consolidated financial
statements was not material.
131