Regions Bank 2010 Annual Report Download - page 62
Download and view the complete annual report
Please find page 62 of the 2010 Regions Bank annual report below. You can navigate through the pages in the report by either clicking on the pages listed below, or by using the keyword search tool below to find specific information within the annual report.-
 1
1 -
2
-
3
-
4
-
5
-
6
-
7
-
8
-
9
-
10
-
11
-
12
-
13
-
14
-
15
-
16
-
17
-
18
-
19
-
20
-
21
-
22
-
23
-
24
-
25
-
26
-
27
-
28
-
29
-
30
-
31
-
32
-
33
-
34
-
35
-
36
-
37
-
38
-
39
-
40
-
41
-
42
-
43
-
44
-
45
-
46
-
47
-
48
-
49
-
50
-
51
-
 52
52 -
 53
53 -
 54
54 -
 55
55 -
 56
56 -
 57
57 -
 58
58 -
 59
59 -
 60
60 -
 61
61 -
 62
62 -
 63
63 -
 64
64 -
 65
65 -
 66
66 -
 67
67 -
 68
68 -
 69
69 -
 70
70 -
 71
71 -
 72
72 -
73
-
74
-
75
-
76
-
77
-
78
-
79
-
80
-
81
-
82
-
83
-
84
-
85
-
86
-
87
-
88
-
89
-
90
-
91
-
92
-
93
-
94
-
95
-
96
-
97
-
98
-
99
-
100
-
101
-
102
-
103
-
104
-
105
-
106
-
107
-
108
-
109
-
110
-
111
-
112
-
113
-
114
-
115
-
116
-
117
-
118
-
119
-
120
-
121
-
122
-
123
-
124
-
125
-
126
-
127
-
128
-
129
-
130
-
131
-
132
-
133
-
134
-
135
-
136
-
137
-
138
-
139
-
140
-
141
-
142
-
143
-
144
-
145
-
146
-
147
-
148
-
149
-
150
-
151
-
152
-
153
-
154
-
155
-
156
-
157
-
158
-
159
-
160
-
161
-
162
-
163
-
164
-
165
-
166
-
167
-
168
-
169
-
170
-
171
-
172
-
173
-
174
-
175
-
176
-
177
-
178
-
179
-
180
-
181
-
182
-
183
-
184
-
185
-
186
-
187
-
188
-
189
-
190
-
191
-
192
-
193
-
194
-
195
-
196
-
197
-
198
-
199
-
200
-
201
-
202
-
203
-
204
-
205
-
206
-
207
-
208
-
209
-
210
-
211
-
212
-
213
-
214
-
215
-
216
-
217
-
218
-
219
-
220
-
221
-
222
-
223
-
224
-
225
-
226
-
227
-
228
-
229
-
230
-
231
-
232
-
233
-
234
-
235
-
236
 |
 |
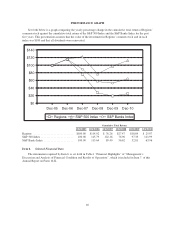
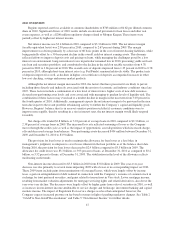
Non-interest expense from continuing operations totaled $5.0 billion in 2010 compared to $4.8 billion in
2009. The year-over-year increase was driven largely by a $200 million nondeductible regulatory charge related
to Morgan Keegan, losses on early extinguishments of debt related to prepayment of Federal Home Loan Bank
advances, and increased FDIC premiums. Higher salaries and employee benefits and credit-related costs such as
other-real-estate-owned expense also contributed to the increase. These items were partially offset by lower
other-than-temporary impairment on securities and a 2009 FDIC special assessment which did not repeat in
2010. See Table 8 “Non-Interest Expense (including Non-GAAP Reconciliation)” for further details.
Total loans decreased by $7.8 billion, or 8.6 percent in 2010, driven primarily by a strategic decision to
lower exposure to investor real estate. Decreases in residential first mortgage, home equity, and indirect loans
also contributed to the year-over-year decrease primarily resulting from consumers’ decisions to de-leverage.
Total deposits decreased $4.1 billion in 2010 to $94.6 billion at December 31, 2010, primarily due to maturities
of time deposits. However, low-cost customer deposits increased $4.7 billion, or 7 percent in 2010.
Regions’ Tier 1 common and Tier 1 capital ratios were 7.85 percent and 12.40 percent at December 31,
2010. Pro forma calculations indicate that the corresponding Basel III ratios, based on Regions’ current
understanding of the guidelines, are approximately 7.62 percent and 11.35 percent, above the respective Basel III
minimums of 7 percent and 8.5 percent.
The Dodd-Frank Wall Street Reform and Consumer Protection Act (“Dodd-Frank Act”) which was signed
into law on July 21, 2010 provides some level of clarity regarding how the industry and Regions’ specific
business will be affected moving forward. However, provisions in the Dodd-Frank Act remain subject to
regulatory rule-making and implementation, and it will be some time before the business implications are
completely defined. Proposed rules regarding regulation of interchange income would have a significant negative
impact on non-interest revenues if adopted as drafted. In 2010, Regions collected $346 million in debit card
income. Based on the current proposed rule, absent any mitigating actions, revenues from debit card income
would likely be reduced to approximately one quarter of current levels, assuming a cap of 12 cents per
transaction. Non-interest expenses (e.g., FDIC insurance premiums, compliance costs, and other regulatory fees)
will also be negatively impacted by provisions included in the legislation. Additionally, trust preferred securities
will be phased out as an allowable component of Tier 1 capital over a three-year period beginning in 2013.
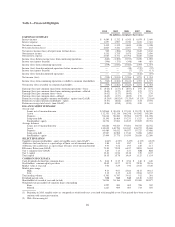
Table 2 “GAAP to Non-GAAP Reconciliation” presents computations of earnings and certain other
financial measures excluding merger, goodwill impairment and regulatory charges, including “efficiency ratio”,
“average tangible common stockholders’ equity”, end of period “tangible common stockholders’ equity” and
“Tier 1 common equity”, all of which are non-GAAP. Merger, goodwill impairment and regulatory charges are
included in financial results presented in accordance with generally accepted accounting principles (“GAAP”).
Regions believes the exclusion of merger, goodwill impairment and regulatory charges in expressing earnings
and certain other financial measures, including “earnings per common share, excluding merger, goodwill
impairment and regulatory charges” and “return on average tangible common stockholders’ equity, excluding
merger, goodwill impairment and regulatory charges” provides a meaningful base for period-to-period and
company-to-company comparisons, which management believes will assist investors in analyzing the operating
results of the Company and predicting future performance. These non-GAAP financial measures are also used by
management to assess the performance of Regions’ business, because management does not consider these
charges to be relevant to ongoing operating results. Management and the Board of Directors utilize these
non-GAAP financial measures as follows:
• Preparation of Regions’ operating budgets
• Monthly financial performance reporting
• Monthly close-out “flash” reporting of consolidated results (management only)
• Presentations to investors of Company performance
48