Regions Bank 2010 Annual Report Download - page 87
Download and view the complete annual report
Please find page 87 of the 2010 Regions Bank annual report below. You can navigate through the pages in the report by either clicking on the pages listed below, or by using the keyword search tool below to find specific information within the annual report.-
 1
1 -
2
-
3
-
4
-
5
-
6
-
7
-
8
-
9
-
10
-
11
-
12
-
13
-
14
-
15
-
16
-
17
-
18
-
19
-
20
-
21
-
22
-
23
-
24
-
25
-
26
-
27
-
28
-
29
-
30
-
31
-
32
-
33
-
34
-
35
-
36
-
37
-
38
-
39
-
40
-
41
-
42
-
43
-
44
-
45
-
46
-
47
-
48
-
49
-
50
-
51
-
52
-
53
-
54
-
55
-
56
-
57
-
58
-
59
-
60
-
61
-
62
-
63
-
64
-
65
-
66
-
67
-
68
-
69
-
70
-
71
-
72
-
73
-
74
-
75
-
76
-
 77
77 -
 78
78 -
 79
79 -
 80
80 -
 81
81 -
 82
82 -
 83
83 -
 84
84 -
 85
85 -
 86
86 -
 87
87 -
 88
88 -
 89
89 -
 90
90 -
 91
91 -
 92
92 -
 93
93 -
 94
94 -
 95
95 -
 96
96 -
 97
97 -
98
-
99
-
100
-
101
-
102
-
103
-
104
-
105
-
106
-
107
-
108
-
109
-
110
-
111
-
112
-
113
-
114
-
115
-
116
-
117
-
118
-
119
-
120
-
121
-
122
-
123
-
124
-
125
-
126
-
127
-
128
-
129
-
130
-
131
-
132
-
133
-
134
-
135
-
136
-
137
-
138
-
139
-
140
-
141
-
142
-
143
-
144
-
145
-
146
-
147
-
148
-
149
-
150
-
151
-
152
-
153
-
154
-
155
-
156
-
157
-
158
-
159
-
160
-
161
-
162
-
163
-
164
-
165
-
166
-
167
-
168
-
169
-
170
-
171
-
172
-
173
-
174
-
175
-
176
-
177
-
178
-
179
-
180
-
181
-
182
-
183
-
184
-
185
-
186
-
187
-
188
-
189
-
190
-
191
-
192
-
193
-
194
-
195
-
196
-
197
-
198
-
199
-
200
-
201
-
202
-
203
-
204
-
205
-
206
-
207
-
208
-
209
-
210
-
211
-
212
-
213
-
214
-
215
-
216
-
217
-
218
-
219
-
220
-
221
-
222
-
223
-
224
-
225
-
226
-
227
-
228
-
229
-
230
-
231
-
232
-
233
-
234
-
235
-
236
 |
 |
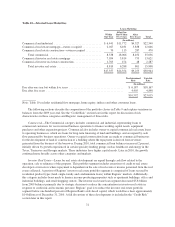
Residential First Mortgage—Residential first mortgage loans represent loans to consumers to finance a
residence. These loans are typically financed over a 15 to 30 year term and, in most cases, are extended to
borrowers to finance their primary residence. These loans experienced a $734 million decline to $14.9 billion in
2010, primarily due to a $965 million sale of residential first mortgages in the fourth quarter of 2010 in order to
improve the Company’s capital and liquidity profile. Lower mortgage origination volume due to decreased net
new refinance activity in 2010 as compared to 2009 also contributed to the decrease. Mortgage originations
totaled $8.2 billion in 2010 as compared to $9.6 billion in 2009. Also, property values continued to decline, new
and used home sales remained at historically low levels and credit markets contracted in general. See the “Credit
Risk” section later in this report for additional discussion.
Home Equity—Home equity lending includes both home equity loans and lines of credit. This type of
lending, which is secured by a first or second mortgage on the borrower’s residence, allows customers to borrow
against the equity in their home. Real estate market values as of the time the loan or line is secured directly affect
the amount of credit extended and, in addition, changes in these values impact the depth of potential losses. The
vast majority of Regions’ home equity lending balances was originated through its branch network. During 2010,
home equity balances decreased $1.2 billion to $14.2 billion, driven by the continued general decline in demand
and lower property valuations across the Company’s operating footprint. During 2010, credit quality within the
home equity portfolio continued to reflect pressure. Charge-offs during 2010 were elevated, but relatively stable
as compared to 2009. The majority of the credit losses from this portfolio are related to loans where the collateral
is a second lien located in Florida. A full discussion of these developments is included in the “Credit Risk”
section later in this report.
Indirect—Indirect lending, which is lending initiated through third-party business partners, is largely
comprised of loans made through automotive dealerships. This portfolio class decreased $860 million or 35
percent in 2010, reflecting the 2008 suspension of new originations within the indirect auto lending business and
the 2007 suspension of the marine and recreational vehicle lending business. Beginning in late 2010, the
Company re-entered the indirect auto lending business.
Other Consumer—Other consumer loans include direct consumer installment loans, overdrafts and other
revolving credit, and educational loans. Other consumer loans totaled $1.2 billion at December 31, 2010,
relatively unchanged from the prior year.
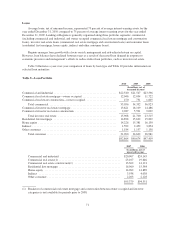
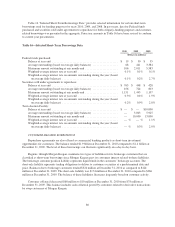
Loans Held for Sale
At December 31, 2010, loans held for sale totaled $1.5 billion, consisting of $1.2 billion of residential real
estate mortgage loans and $304 million of non-performing investor real estate loans. At December 31, 2009,
loans held for sale also totaled $1.5 billion, consisting of $783 million of residential real estate mortgage loans,
$411 million of student loans and $317 million of non-performing investor real estate loans. The level of
residential real estate mortgage and student loans held for sale fluctuates depending on the timing of origination
and sale to third parties.
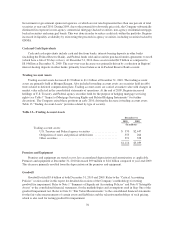
Allowance for Credit Losses
The allowance for credit losses represents management’s estimate of credit losses inherent in both the loan
portfolio and unfunded credit commitments as of the balance sheet date. The allowance consists of two
components: the allowance for loans losses, which is recorded as a contra-asset to loans, and the reserve for
unfunded credit commitments, which is recorded in other liabilities. At December 31, 2010, the allowance for
credit losses totaled $3.3 billion or 3.93 percent of loans, net of unearned income, compared to $3.2 billion or
3.52 percent at year-end 2009. See “Allowance for Credit Losses” in the “Credit Risk” section found later in this
report for a detailed discussion of the allowance.
73