Regions Bank 2010 Annual Report Download - page 166
Download and view the complete annual report
Please find page 166 of the 2010 Regions Bank annual report below. You can navigate through the pages in the report by either clicking on the pages listed below, or by using the keyword search tool below to find specific information within the annual report.-
 1
1 -
2
-
3
-
4
-
5
-
6
-
7
-
8
-
9
-
10
-
11
-
12
-
13
-
14
-
15
-
16
-
17
-
18
-
19
-
20
-
21
-
22
-
23
-
24
-
25
-
26
-
27
-
28
-
29
-
30
-
31
-
32
-
33
-
34
-
35
-
36
-
37
-
38
-
39
-
40
-
41
-
42
-
43
-
44
-
45
-
46
-
47
-
48
-
49
-
50
-
51
-
52
-
53
-
54
-
55
-
56
-
57
-
58
-
59
-
60
-
61
-
62
-
63
-
64
-
65
-
66
-
67
-
68
-
69
-
70
-
71
-
72
-
73
-
74
-
75
-
76
-
77
-
78
-
79
-
80
-
81
-
82
-
83
-
84
-
85
-
86
-
87
-
88
-
89
-
90
-
91
-
92
-
93
-
94
-
95
-
96
-
97
-
98
-
99
-
100
-
101
-
102
-
103
-
104
-
105
-
106
-
107
-
108
-
109
-
110
-
111
-
112
-
113
-
114
-
115
-
116
-
117
-
118
-
119
-
120
-
121
-
122
-
123
-
124
-
125
-
126
-
127
-
128
-
129
-
130
-
131
-
132
-
133
-
134
-
135
-
136
-
137
-
138
-
139
-
140
-
141
-
142
-
143
-
144
-
145
-
146
-
147
-
148
-
149
-
150
-
151
-
152
-
153
-
154
-
155
-
 156
156 -
 157
157 -
 158
158 -
 159
159 -
 160
160 -
 161
161 -
 162
162 -
 163
163 -
 164
164 -
 165
165 -
 166
166 -
 167
167 -
 168
168 -
 169
169 -
 170
170 -
 171
171 -
 172
172 -
 173
173 -
 174
174 -
 175
175 -
 176
176 -
177
-
178
-
179
-
180
-
181
-
182
-
183
-
184
-
185
-
186
-
187
-
188
-
189
-
190
-
191
-
192
-
193
-
194
-
195
-
196
-
197
-
198
-
199
-
200
-
201
-
202
-
203
-
204
-
205
-
206
-
207
-
208
-
209
-
210
-
211
-
212
-
213
-
214
-
215
-
216
-
217
-
218
-
219
-
220
-
221
-
222
-
223
-
224
-
225
-
226
-
227
-
228
-
229
-
230
-
231
-
232
-
233
-
234
-
235
-
236
 |
 |

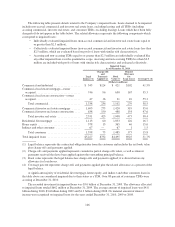
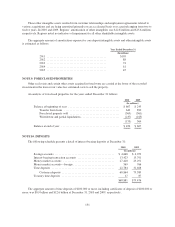
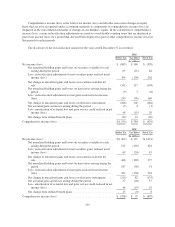
At December 31, 2010, the aggregate amount of maturities of all time deposits (deposits with stated
maturities, consisting primarily of certificates of deposit and IRAs) were as follows:
Year Ended December 31
(In millions)
2011 ........................................ $14,307
2012 ........................................ 4,466
2013 ........................................ 3,216
2014 ........................................ 225
2015 ........................................ 556
Thereafter .................................... 31
$22,801
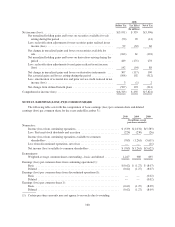
NOTE 11. SHORT-TERM BORROWINGS
Following is a summary of short-term borrowings at December 31:
2010 2009
(In millions)
Company funding sources:
Federal funds purchased .................................. $ 19 $ 30
Securities sold under agreements to repurchase ................ 763 448
Federal Home Loan Bank advances ......................... 500 1,000
Treasury, tax and loan notes ............................... 118 7
Other short-term borrowings ............................... 95 —
1,495 1,485
Customer-related borrowings:
Securities sold under agreements to repurchase ................ 1,934 1,415
Brokerage customer liabilities .............................. 324 424
Short-sale liability ....................................... 174 266
Customer collateral ...................................... 10 78
2,442 2,183
$3,937 $3,668
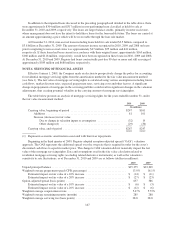
COMPANY FUNDING SOURCES
The levels of federal funds purchased and securities sold under agreements to repurchase can fluctuate
significantly on a day-to-day basis, depending on funding needs and which sources are used to satisfy those
needs. All such arrangements are considered typical of the banking and brokerage industries and are accounted
for as borrowings. Federal funds purchased had weighted-average maturities of 3 days and 4 days at
December 31, 2010 and 2009, respectively. Weighted-average rates paid during 2010 and 2009 were 0.1% and
0.2%, respectively. Securities sold under agreements to repurchase had weighted-average maturities of 27 days
and 13 days at December 31, 2010 and 2009, respectively. Weighted-average rates paid during 2010 and 2009
were 0.2% and 0.9%, respectively.
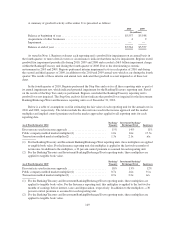
As another source of funding, the Company utilized short-term borrowings through the issuance of FHLB
advances. FHLB borrowings are used to satisfy short-term and long-term borrowing needs and can also fluctuate
between periods. See Note 12 for further discussion of Regions’ borrowing capacity with the FHLB.
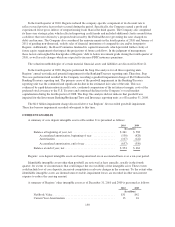
Treasury, tax and loan notes consist of borrowings from the Federal Reserve Bank. At December 31, 2010,
Regions could borrow a maximum amount of approximately $16.6 billion from the Federal Reserve Bank
Discount Window. See Note 4 for loans pledged to the Federal Reserve Bank at December 31, 2010 and 2009.
152