Regions Bank 2010 Annual Report Download - page 127
Download and view the complete annual report
Please find page 127 of the 2010 Regions Bank annual report below. You can navigate through the pages in the report by either clicking on the pages listed below, or by using the keyword search tool below to find specific information within the annual report.-
 1
1 -
2
-
3
-
4
-
5
-
6
-
7
-
8
-
9
-
10
-
11
-
12
-
13
-
14
-
15
-
16
-
17
-
18
-
19
-
20
-
21
-
22
-
23
-
24
-
25
-
26
-
27
-
28
-
29
-
30
-
31
-
32
-
33
-
34
-
35
-
36
-
37
-
38
-
39
-
40
-
41
-
42
-
43
-
44
-
45
-
46
-
47
-
48
-
49
-
50
-
51
-
52
-
53
-
54
-
55
-
56
-
57
-
58
-
59
-
60
-
61
-
62
-
63
-
64
-
65
-
66
-
67
-
68
-
69
-
70
-
71
-
72
-
73
-
74
-
75
-
76
-
77
-
78
-
79
-
80
-
81
-
82
-
83
-
84
-
85
-
86
-
87
-
88
-
89
-
90
-
91
-
92
-
93
-
94
-
95
-
96
-
97
-
98
-
99
-
100
-
101
-
102
-
103
-
104
-
105
-
106
-
107
-
108
-
109
-
110
-
111
-
112
-
113
-
114
-
115
-
116
-
 117
117 -
 118
118 -
 119
119 -
 120
120 -
 121
121 -
 122
122 -
 123
123 -
 124
124 -
 125
125 -
 126
126 -
 127
127 -
 128
128 -
 129
129 -
 130
130 -
 131
131 -
 132
132 -
 133
133 -
 134
134 -
 135
135 -
 136
136 -
 137
137 -
138
-
139
-
140
-
141
-
142
-
143
-
144
-
145
-
146
-
147
-
148
-
149
-
150
-
151
-
152
-
153
-
154
-
155
-
156
-
157
-
158
-
159
-
160
-
161
-
162
-
163
-
164
-
165
-
166
-
167
-
168
-
169
-
170
-
171
-
172
-
173
-
174
-
175
-
176
-
177
-
178
-
179
-
180
-
181
-
182
-
183
-
184
-
185
-
186
-
187
-
188
-
189
-
190
-
191
-
192
-
193
-
194
-
195
-
196
-
197
-
198
-
199
-
200
-
201
-
202
-
203
-
204
-
205
-
206
-
207
-
208
-
209
-
210
-
211
-
212
-
213
-
214
-
215
-
216
-
217
-
218
-
219
-
220
-
221
-
222
-
223
-
224
-
225
-
226
-
227
-
228
-
229
-
230
-
231
-
232
-
233
-
234
-
235
-
236
 |
 |

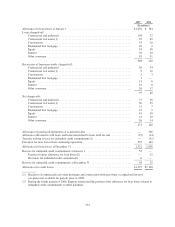
provision for loan losses of $2.1 billion and net charge-offs of $1.5 billion in 2008. The increase in the provision
was primarily due to focused efforts to identify and address loan portfolio pressure, as well as continued
deterioration in the land, single-family, condominium and home equity portfolios. Income-producing investor
real estate, including multi-family and retail, also contributed to the increased level of non-performing loans,
which significantly impacts the level of the provision.
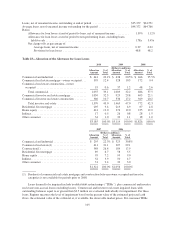
At December 31, 2009, the allowance for loan losses totaled $3.1 billion or 3.43 percent of total loans, net
of unearned income compared to $1.8 billion or 1.87 percent at year-end 2008. The increase in the allowance for
loan loss ratio reflects management’s estimate of the level of inherent losses in the portfolio, which continued to
increase during 2009 due to a recessionary economy, rising unemployment, a weakened housing market and
deterioration in income-producing properties. The increase in non-performing assets, driven by land, single-
family and condominium loans and income producing investor real estate loans, was a key determining dynamic
in the assessment of inherent losses and, as a result, was an important factor in determining the allowance level.
Additionally, unfavorable migration between risk rating categories drove higher allowance allocation rates for
these loan portfolios.
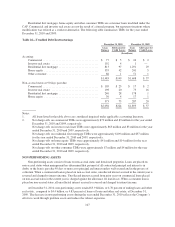
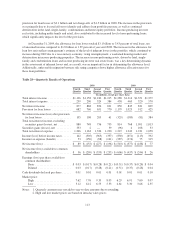
Table 28—Quarterly Results of Operations
2010 2009
Fourth
Quarter
Third
Quarter
Second
Quarter
First
Quarter
Fourth
Quarter
Third
Quarter
Second
Quarter
First
Quarter
(In millions, except per share data)
Total interest income ................ $1,136 $1,158 $1,180 $1,215 $1,288 $1,314 $1,351 $1,379
Total interest expense ................ 259 290 324 384 438 469 520 570
Net interest income ................. 877 868 856 831 850 845 831 809
Provision for loan losses ............. 682 760 651 770 1,179 1,025 912 425
Net interest income (loss) after provision
for loan losses .................... 195 108 205 61 (329) (180) (81) 384
Total non-interest income, excluding
securities gains (losses), net ......... 880 748 756 753 814 768 1,091 1,013
Securities gains (losses), net .......... 333 2 — 59 (96) 4 108 53
Total non-interest expense ............ 1,266 1,163 1,326 1,230 1,219 1,243 1,231 1,058
Income (loss) before income taxes ...... 142 (305) (365) (357) (830) (651) (113) 392
Income tax expense (benefit) .......... 53 (150) (88) (161) (287) (274) 75 315
Net income (loss) ................... $ 89 $ (155) $ (277) $ (196) $ (543) $ (377) $ (188) $ 77
Net income (loss) available to common
shareholders ..................... $ 36 $ (209) $ (335) $ (255) $ (606) $ (437) $ (244) $ 26
Earnings (loss) per share available to
common shareholders:
Basic ......................... $ 0.03 $ (0.17) $ (0.28) $ (0.21) $ (0.51) $ (0.37) $ (0.28) $ 0.04
Diluted ....................... 0.03 (0.17) (0.28) (0.21) (0.51) (0.37) (0.28) 0.04
Cash dividends declared per share ...... 0.01 0.01 0.01 0.01 0.01 0.01 0.01 0.10
Market price:
High ......................... 7.62 7.76 9.33 8.05 6.29 6.91 7.60 9.07
Low.......................... 5.12 6.12 6.55 5.33 4.61 3.30 3.66 2.35
Notes: 1. Quarterly amounts may not add to year-to-date amounts due to rounding.
2. High and low market prices are based on intraday sales prices.
113