Regions Bank 2010 Annual Report Download - page 78
Download and view the complete annual report
Please find page 78 of the 2010 Regions Bank annual report below. You can navigate through the pages in the report by either clicking on the pages listed below, or by using the keyword search tool below to find specific information within the annual report.-
 1
1 -
2
-
3
-
4
-
5
-
6
-
7
-
8
-
9
-
10
-
11
-
12
-
13
-
14
-
15
-
16
-
17
-
18
-
19
-
20
-
21
-
22
-
23
-
24
-
25
-
26
-
27
-
28
-
29
-
30
-
31
-
32
-
33
-
34
-
35
-
36
-
37
-
38
-
39
-
40
-
41
-
42
-
43
-
44
-
45
-
46
-
47
-
48
-
49
-
50
-
51
-
52
-
53
-
54
-
55
-
56
-
57
-
58
-
59
-
60
-
61
-
62
-
63
-
64
-
65
-
66
-
67
-
 68
68 -
 69
69 -
 70
70 -
 71
71 -
 72
72 -
 73
73 -
 74
74 -
 75
75 -
 76
76 -
 77
77 -
 78
78 -
 79
79 -
 80
80 -
 81
81 -
 82
82 -
 83
83 -
 84
84 -
 85
85 -
 86
86 -
 87
87 -
 88
88 -
89
-
90
-
91
-
92
-
93
-
94
-
95
-
96
-
97
-
98
-
99
-
100
-
101
-
102
-
103
-
104
-
105
-
106
-
107
-
108
-
109
-
110
-
111
-
112
-
113
-
114
-
115
-
116
-
117
-
118
-
119
-
120
-
121
-
122
-
123
-
124
-
125
-
126
-
127
-
128
-
129
-
130
-
131
-
132
-
133
-
134
-
135
-
136
-
137
-
138
-
139
-
140
-
141
-
142
-
143
-
144
-
145
-
146
-
147
-
148
-
149
-
150
-
151
-
152
-
153
-
154
-
155
-
156
-
157
-
158
-
159
-
160
-
161
-
162
-
163
-
164
-
165
-
166
-
167
-
168
-
169
-
170
-
171
-
172
-
173
-
174
-
175
-
176
-
177
-
178
-
179
-
180
-
181
-
182
-
183
-
184
-
185
-
186
-
187
-
188
-
189
-
190
-
191
-
192
-
193
-
194
-
195
-
196
-
197
-
198
-
199
-
200
-
201
-
202
-
203
-
204
-
205
-
206
-
207
-
208
-
209
-
210
-
211
-
212
-
213
-
214
-
215
-
216
-
217
-
218
-
219
-
220
-
221
-
222
-
223
-
224
-
225
-
226
-
227
-
228
-
229
-
230
-
231
-
232
-
233
-
234
-
235
-
236
 |
 |

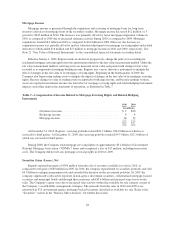
Mortgage Income
Mortgage income is generated through the origination and servicing of mortgage loans for long-term
investors and sales of mortgage loans in the secondary market. Mortgage income decreased $12 million, or 5
percent to $247 million in 2010. The decrease was primarily driven by lower mortgage origination volume in
2010 as compared to 2009 due to decreased refinance activity during 2010 as compared to 2009. Mortgage
originations totaled $8.2 billion in 2010 as compared to $9.6 billion in 2009. However, the decrease in
origination income was partially offset by market valuation adjustments for mortgage servicing rights and related
derivatives which added $16 million and $13 million to mortgage income in 2010 and 2009, respectively. See
Note 21 “Fair Value of Financial Instruments” to the consolidated financial statements for further detail.
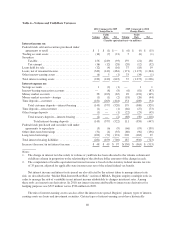
Effective January 1, 2009, Regions made an election to prospectively change the policy for accounting for
residential mortgage servicing rights from the amortization method to the fair value measurement method. Under the
fair value measurement method, servicing assets are measured at fair value each period with changes in fair value
recorded as a component of mortgage banking income. Regions uses various derivative instruments to mitigate the
effect of changes in the fair value of its mortgage servicing rights. Beginning in the fourth quarter of 2009, the
Company also began using trading assets to mitigate the impact of changes in the fair value of its mortgage servicing
rights. Because changes in value of trading assets are reported in brokerage income, and because earnings on these
assets are reported in net interest income, the total effect of mortgage servicing rights and related hedging instruments
impacts several line items in the statements of operations, as illustrated in Table 7.
Table 7—Categorization of Income Related to Mortgage Servicing Rights and Related Hedging
Instruments
2010 2009
(In millions)
Net interest income ....................................... $ 3 $20
Brokerage income ........................................ 4 4
Mortgage income ........................................ 16 13
$23 $37
At December 31, 2010, Regions’ servicing portfolio totaled $41.7 billion, $26.0 billion of which was
serviced for third parties. At December 31, 2009, the servicing portfolio totaled $39.7 billion, $23.3 billion of
which was serviced for third parties.
During 2008, the Company sold mortgage servicing rights on approximately $3.4 billion of Government
National Mortgage Association (“GNMA”) loans and recognized a loss of $15 million, including transaction
costs. The Company did not sell any mortgage servicing rights in 2010 or 2009.
Securities Gains (Losses), Net
Regions reported net gains of $394 million from the sale of securities available for sale in 2010, as
compared to net gains of $69 million in 2009. In 2010, the company repositioned its securities portfolio and sold
$9.9 billion to mitigate prepayment risk and extended the duration on the investment portfolio. In 2009, the
company significantly reduced its exposure in non-agency investment securities, collateralized mortgage-backed
securities and municipal bonds and through these measures sold $5.4 billion and incurred some losses on the
sales. The Company’s gains were due to increased sales activity within the available for sale category as part of
the Company’s asset/liability management strategies. The proceeds from the sales in 2010 and 2009 were
reinvested in U.S. government agency mortgage-backed securities classified as available for sale. Refer to the
“Securities” section in the “Balance Sheet Analysis” for further discussion.
64