Regions Bank 2010 Annual Report Download - page 164
Download and view the complete annual report
Please find page 164 of the 2010 Regions Bank annual report below. You can navigate through the pages in the report by either clicking on the pages listed below, or by using the keyword search tool below to find specific information within the annual report.-
 1
1 -
2
-
3
-
4
-
5
-
6
-
7
-
8
-
9
-
10
-
11
-
12
-
13
-
14
-
15
-
16
-
17
-
18
-
19
-
20
-
21
-
22
-
23
-
24
-
25
-
26
-
27
-
28
-
29
-
30
-
31
-
32
-
33
-
34
-
35
-
36
-
37
-
38
-
39
-
40
-
41
-
42
-
43
-
44
-
45
-
46
-
47
-
48
-
49
-
50
-
51
-
52
-
53
-
54
-
55
-
56
-
57
-
58
-
59
-
60
-
61
-
62
-
63
-
64
-
65
-
66
-
67
-
68
-
69
-
70
-
71
-
72
-
73
-
74
-
75
-
76
-
77
-
78
-
79
-
80
-
81
-
82
-
83
-
84
-
85
-
86
-
87
-
88
-
89
-
90
-
91
-
92
-
93
-
94
-
95
-
96
-
97
-
98
-
99
-
100
-
101
-
102
-
103
-
104
-
105
-
106
-
107
-
108
-
109
-
110
-
111
-
112
-
113
-
114
-
115
-
116
-
117
-
118
-
119
-
120
-
121
-
122
-
123
-
124
-
125
-
126
-
127
-
128
-
129
-
130
-
131
-
132
-
133
-
134
-
135
-
136
-
137
-
138
-
139
-
140
-
141
-
142
-
143
-
144
-
145
-
146
-
147
-
148
-
149
-
150
-
151
-
152
-
153
-
 154
154 -
 155
155 -
 156
156 -
 157
157 -
 158
158 -
 159
159 -
 160
160 -
 161
161 -
 162
162 -
 163
163 -
 164
164 -
 165
165 -
 166
166 -
 167
167 -
 168
168 -
 169
169 -
 170
170 -
 171
171 -
 172
172 -
 173
173 -
 174
174 -
175
-
176
-
177
-
178
-
179
-
180
-
181
-
182
-
183
-
184
-
185
-
186
-
187
-
188
-
189
-
190
-
191
-
192
-
193
-
194
-
195
-
196
-
197
-
198
-
199
-
200
-
201
-
202
-
203
-
204
-
205
-
206
-
207
-
208
-
209
-
210
-
211
-
212
-
213
-
214
-
215
-
216
-
217
-
218
-
219
-
220
-
221
-
222
-
223
-
224
-
225
-
226
-
227
-
228
-
229
-
230
-
231
-
232
-
233
-
234
-
235
-
236
 |
 |

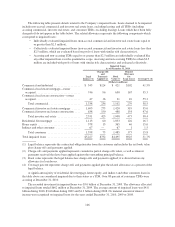
In the fourth quarter of 2010, Regions reduced the company-specific component of its discount rate to
reflect several positive factors that occurred during the period. Specifically, the Company earned a profit and
experienced lower gross inflows of nonperforming loans than in the third quarter. The Company also completed
its three-year strategic plan, which reflected improving credit trends and included additional clarity around future
cash flows that were driven by a proposed rule issued by the Federal Reserve governing the rates charged on
debit card income. The Company also considered the announcements in the fourth quarter of 2010 and January of
2011 of pending non-distressed, orderly sales of financial institutions of comparable size and/or footprint to
Regions. Additionally, the Basel Committee finalized its capital framework, which provided further clarity of
future equity requirements that impact the projections of future cash flows. In the judgment of management,
these factors outweighed the downgrades of Regions’ debt to below investment grade during the fourth quarter of
2010, as well as rule changes which are expected to increase FDIC insurance premiums.
The valuation methodologies of certain material financial assets and liabilities are discussed in Note 21.
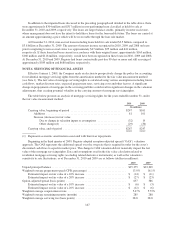
In the fourth quarter of 2008, Regions performed the Step One analysis for all three reporting units.
Regions’ annual test indicated potential impairment for the Banking/Treasury reporting unit. Therefore, Step
Two was performed and resulted in the Company recording a goodwill impairment charge of $6.0 billion in the
Banking/Treasury reporting unit. The primary cause of the goodwill impairment in the Banking/Treasury
reporting unit was the continued and significant decline in the estimated fair value of the unit. This was
evidenced by rapid deterioration in credit costs, continued compression of the net interest margin, costs of the
preferred stock issuance to the U.S. Treasury and continued declines in the Company’s overall market
capitalization during the fourth quarter of 2008. The Step One analysis did not indicate that goodwill was
impaired for the Investment Banking/Brokerage/Trust and Insurance reporting units as of December 31, 2008.
The $6.0 billion impairment charge discussed above was Regions’ first recorded goodwill impairment.
There has been no impairment recorded subsequent to this time.
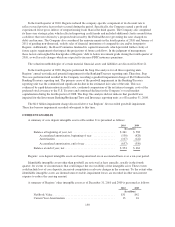
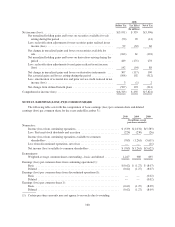
OTHER INTANGIBLES
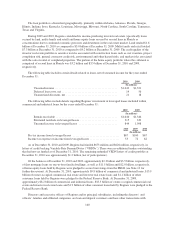
A summary of core deposit intangible assets at December 31 is presented as follows:
2010 2009
(In millions)
Balance at beginning of year, net ............................. $461 $583
Accumulated amortization, beginning of year ............... (550) (428)
Amortization ......................................... (107) (122)
Accumulated amortization, end of year ..................... (657) (550)
Balance at end of year, net ................................... $354 $461
Regions’ core deposit intangible assets are being amortized on an accelerated basis over a ten-year period.
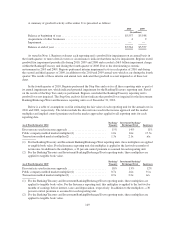
Identifiable intangible assets other than goodwill are reviewed at least annually, usually in the fourth
quarter, for events or circumstances that could impact the recoverability of the intangible asset. These events
could include loss of core deposits, increased competition or adverse changes in the economy. To the extent other
identifiable intangible assets are deemed unrecoverable, impairment losses are recorded in other non-interest
expense to reduce the carrying amount.
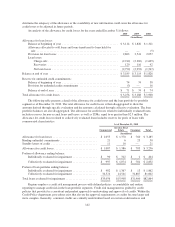
A summary of Regions’ other intangible assets as of December 31, 2010 and 2009 is presented as follows:
2010 2009
(In millions)
Net Book Value ........................................... $31 $42
Current Year Amortization .................................. 13 16
150