Regions Bank 2010 Annual Report Download - page 131
Download and view the complete annual report
Please find page 131 of the 2010 Regions Bank annual report below. You can navigate through the pages in the report by either clicking on the pages listed below, or by using the keyword search tool below to find specific information within the annual report.-
 1
1 -
2
-
3
-
4
-
5
-
6
-
7
-
8
-
9
-
10
-
11
-
12
-
13
-
14
-
15
-
16
-
17
-
18
-
19
-
20
-
21
-
22
-
23
-
24
-
25
-
26
-
27
-
28
-
29
-
30
-
31
-
32
-
33
-
34
-
35
-
36
-
37
-
38
-
39
-
40
-
41
-
42
-
43
-
44
-
45
-
46
-
47
-
48
-
49
-
50
-
51
-
52
-
53
-
54
-
55
-
56
-
57
-
58
-
59
-
60
-
61
-
62
-
63
-
64
-
65
-
66
-
67
-
68
-
69
-
70
-
71
-
72
-
73
-
74
-
75
-
76
-
77
-
78
-
79
-
80
-
81
-
82
-
83
-
84
-
85
-
86
-
87
-
88
-
89
-
90
-
91
-
92
-
93
-
94
-
95
-
96
-
97
-
98
-
99
-
100
-
101
-
102
-
103
-
104
-
105
-
106
-
107
-
108
-
109
-
110
-
111
-
112
-
113
-
114
-
115
-
116
-
117
-
118
-
119
-
120
-
 121
121 -
 122
122 -
 123
123 -
 124
124 -
 125
125 -
 126
126 -
 127
127 -
 128
128 -
 129
129 -
 130
130 -
 131
131 -
 132
132 -
 133
133 -
 134
134 -
 135
135 -
 136
136 -
 137
137 -
 138
138 -
 139
139 -
 140
140 -
 141
141 -
142
-
143
-
144
-
145
-
146
-
147
-
148
-
149
-
150
-
151
-
152
-
153
-
154
-
155
-
156
-
157
-
158
-
159
-
160
-
161
-
162
-
163
-
164
-
165
-
166
-
167
-
168
-
169
-
170
-
171
-
172
-
173
-
174
-
175
-
176
-
177
-
178
-
179
-
180
-
181
-
182
-
183
-
184
-
185
-
186
-
187
-
188
-
189
-
190
-
191
-
192
-
193
-
194
-
195
-
196
-
197
-
198
-
199
-
200
-
201
-
202
-
203
-
204
-
205
-
206
-
207
-
208
-
209
-
210
-
211
-
212
-
213
-
214
-
215
-
216
-
217
-
218
-
219
-
220
-
221
-
222
-
223
-
224
-
225
-
226
-
227
-
228
-
229
-
230
-
231
-
232
-
233
-
234
-
235
-
236
 |
 |

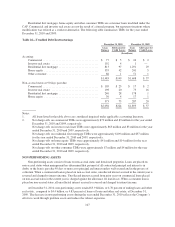
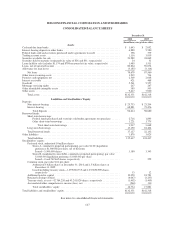
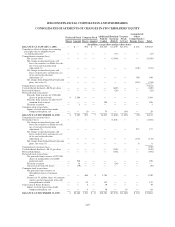
REGIONS FINANCIAL CORPORATION AND SUBSIDIARIES
CONSOLIDATED BALANCE SHEETS
December 31
2010 2009
(In millions, except share data)
Assets
Cash and due from banks ....................................................... $ 1,643 $ 2,052
Interest-bearing deposits in other banks ........................................... 4,880 5,580
Federal funds sold and securities purchased under agreements to resell .................. 396 379
Trading account assets ......................................................... 1,116 3,039
Securities available for sale ..................................................... 23,289 24,069
Securities held to maturity (estimated fair value of $26 and $31, respectively) ............. 24 31
Loans held for sale (includes $1,174 and $780 measured at fair value, respectively) ........ 1,485 1,511
Loans, net of unearned income .................................................. 82,864 90,674
Allowance for loan losses ...................................................... (3,185) (3,114)
Net loans ............................................................... 79,679 87,560
Other interest-earning assets .................................................... 1,219 734
Premises and equipment, net .................................................... 2,569 2,668
Interest receivable ............................................................ 421 468
Goodwill ................................................................... 5,561 5,557
Mortgage servicing rights ...................................................... 267 247
Other identifiable intangible assets ............................................... 385 503
Other assets ................................................................. 9,417 7,920
Total assets ............................................................. $132,351 $142,318
Liabilities and Stockholders’ Equity
Deposits:
Non-interest-bearing ...................................................... $ 25,733 $ 23,204
Interest-bearing .......................................................... 68,881 75,476
Total deposits ........................................................ 94,614 98,680
Borrowed funds:
Short-term borrowings:
Federal funds purchased and securities sold under agreements to repurchase ...... 2,716 1,893
Other short-term borrowings ............................................ 1,221 1,775
Total short-term borrowings ........................................ 3,937 3,668
Long-term borrowings ..................................................... 13,190 18,464
Total borrowed funds ...................................................... 17,127 22,132
Other liabilities .............................................................. 3,876 3,625
Total liabilities ........................................................... 115,617 124,437
Stockholders’ equity:
Preferred stock, authorized 10 million shares
Series A, cumulative perpetual participating, par value $1.00 (liquidation
preference $1,000.00) per share, net of discount;
Issued—3,500,000 shares ............................................ 3,380 3,343
Series B, mandatorily convertible, cumulative perpetual participating, par value
$1,000.00 (liquidation preference $1,000.00) per share;
Issued—0 and 267,665 shares, respectively .............................. — 259
Common stock, par value $.01 per share:
Authorized 3 billion shares at December 31, 2010 and 1.5 billion shares at
December 31, 2009
Issued including treasury stock—1,299,000,755 and 1,235,850,589 shares,
respectively ....................................................... 13 12
Additional paid-in capital .................................................. 19,050 18,781
Retained earnings (deficit) .................................................. (4,047) (3,235)
Treasury stock, at cost—42,764,258 and 43,241,020 shares, respectively ............. (1,402) (1,409)
Accumulated other comprehensive income (loss), net ............................ (260) 130
Total stockholders’ equity .............................................. 16,734 17,881
Total liabilities and stockholders’ equity ........................................... $132,351 $142,318
See notes to consolidated financial statements.
117