Regions Bank 2010 Annual Report Download - page 103
Download and view the complete annual report
Please find page 103 of the 2010 Regions Bank annual report below. You can navigate through the pages in the report by either clicking on the pages listed below, or by using the keyword search tool below to find specific information within the annual report.-
 1
1 -
2
-
3
-
4
-
5
-
6
-
7
-
8
-
9
-
10
-
11
-
12
-
13
-
14
-
15
-
16
-
17
-
18
-
19
-
20
-
21
-
22
-
23
-
24
-
25
-
26
-
27
-
28
-
29
-
30
-
31
-
32
-
33
-
34
-
35
-
36
-
37
-
38
-
39
-
40
-
41
-
42
-
43
-
44
-
45
-
46
-
47
-
48
-
49
-
50
-
51
-
52
-
53
-
54
-
55
-
56
-
57
-
58
-
59
-
60
-
61
-
62
-
63
-
64
-
65
-
66
-
67
-
68
-
69
-
70
-
71
-
72
-
73
-
74
-
75
-
76
-
77
-
78
-
79
-
80
-
81
-
82
-
83
-
84
-
85
-
86
-
87
-
88
-
89
-
90
-
91
-
92
-
 93
93 -
 94
94 -
 95
95 -
 96
96 -
 97
97 -
 98
98 -
 99
99 -
 100
100 -
 101
101 -
 102
102 -
 103
103 -
 104
104 -
 105
105 -
 106
106 -
 107
107 -
 108
108 -
 109
109 -
 110
110 -
 111
111 -
 112
112 -
 113
113 -
114
-
115
-
116
-
117
-
118
-
119
-
120
-
121
-
122
-
123
-
124
-
125
-
126
-
127
-
128
-
129
-
130
-
131
-
132
-
133
-
134
-
135
-
136
-
137
-
138
-
139
-
140
-
141
-
142
-
143
-
144
-
145
-
146
-
147
-
148
-
149
-
150
-
151
-
152
-
153
-
154
-
155
-
156
-
157
-
158
-
159
-
160
-
161
-
162
-
163
-
164
-
165
-
166
-
167
-
168
-
169
-
170
-
171
-
172
-
173
-
174
-
175
-
176
-
177
-
178
-
179
-
180
-
181
-
182
-
183
-
184
-
185
-
186
-
187
-
188
-
189
-
190
-
191
-
192
-
193
-
194
-
195
-
196
-
197
-
198
-
199
-
200
-
201
-
202
-
203
-
204
-
205
-
206
-
207
-
208
-
209
-
210
-
211
-
212
-
213
-
214
-
215
-
216
-
217
-
218
-
219
-
220
-
221
-
222
-
223
-
224
-
225
-
226
-
227
-
228
-
229
-
230
-
231
-
232
-
233
-
234
-
235
-
236
 |
 |

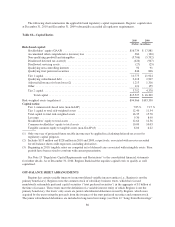
The primary objective of asset/liability management at Regions is to coordinate balance sheet composition
with interest rate risk management to sustain a reasonable and stable net interest income throughout various
interest rate cycles. In computing interest rate sensitivity for measurement, Regions compares a set of alternative
interest rate scenarios to the results of a base case scenario based on “market forward rates.” The standard set of
interest rate scenarios includes the traditional instantaneous parallel rate shifts of plus 100 and 200 basis points.
Regions also prepares a minus 100 basis points scenario; a minus 200 basis point scenario is not considered
realistic in the current rate environment. Up-rate scenarios of greater magnitude are also analyzed, and are of
increased importance as the current and historic low levels of interest rates increase the relative likelihood of a
rapid and substantial increase in interest rates. Regions also includes simulations of gradual interest rate
movements that may more realistically mimic potential interest rate movements. These gradual scenarios include
curve steepening, flattening, and parallel movements of various magnitudes phased in over a six-month period,
and include rate shifts of plus and minus 100 basis points and plus 200 basis points.
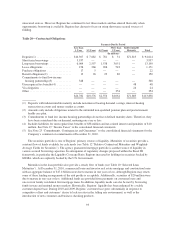
Exposure to Interest Rate Movements—As of December 31, 2010, Regions was moderately asset sensitive
to both gradual and instantaneous rate shifts as compared to the base case for the measurement horizon ending in
December 2011. Regions continues to observe that the pace of economic recovery is at risk of being slow, which
may result in a continuation of this period of low interest rates. To partially offset the adverse impact on net
interest income and net interest margin attributable to an extended period of low interest rates, Regions entered
into a series of receive-fixed interest rate swaps. These instruments have a final maturity in December 2012. The
table below summarizes Regions’ position, and the scenarios are inclusive of all interest-rate risk hedging
activities. Note that where scenarios would indicate negative interest rates, a minimum of zero is applied.
Table 19—Interest Rate Sensitivity
Gradual Change in Interest Rates
Estimated Annual Change in Net Interest Income
December 31, 2010
(In millions)
+200 basis points ........................ $168
+100 basis points ........................ 100
-100 basis points ........................ (65)
Instantaneous Change in Interest Rates
+200 basis points ........................ $225
+100 basis points ........................ 146
-100 basis points ........................ (133)
Interest rate movements may also have an impact on the value of Regions’ securities portfolio, which can
directly impact the carrying value of shareholders’ equity. Regions from time to time may hedge these price
movements with derivatives (as discussed below). However, at December 31, 2010, Regions had no designations
of hedges to mitigate price movements of securities.
Derivatives—Regions uses financial derivative instruments for management of interest rate sensitivity. The
Asset and Liability Committee (“ALCO”), which consists of members of Regions’ senior management team, in
its oversight role for the management of interest rate sensitivity, approves the use of derivatives in balance sheet
hedging strategies. The most common derivatives Regions employs are forward rate contracts, Eurodollar futures
contracts, interest rate swaps, options on interest rate swaps, interest rate caps and floors, and forward sale
commitments. Derivatives are also used to offset the risks associated with customer derivatives, which include
interest rate, credit and foreign exchange risks.
Forward rate contracts are commitments to buy or sell financial instruments at a future date at a specified
price or yield. A Eurodollar futures contract is a future on a Eurodollar deposit. Eurodollar futures contracts
89