Regions Bank 2010 Annual Report Download - page 98
Download and view the complete annual report
Please find page 98 of the 2010 Regions Bank annual report below. You can navigate through the pages in the report by either clicking on the pages listed below, or by using the keyword search tool below to find specific information within the annual report.-
 1
1 -
2
-
3
-
4
-
5
-
6
-
7
-
8
-
9
-
10
-
11
-
12
-
13
-
14
-
15
-
16
-
17
-
18
-
19
-
20
-
21
-
22
-
23
-
24
-
25
-
26
-
27
-
28
-
29
-
30
-
31
-
32
-
33
-
34
-
35
-
36
-
37
-
38
-
39
-
40
-
41
-
42
-
43
-
44
-
45
-
46
-
47
-
48
-
49
-
50
-
51
-
52
-
53
-
54
-
55
-
56
-
57
-
58
-
59
-
60
-
61
-
62
-
63
-
64
-
65
-
66
-
67
-
68
-
69
-
70
-
71
-
72
-
73
-
74
-
75
-
76
-
77
-
78
-
79
-
80
-
81
-
82
-
83
-
84
-
85
-
86
-
87
-
 88
88 -
 89
89 -
 90
90 -
 91
91 -
 92
92 -
 93
93 -
 94
94 -
 95
95 -
 96
96 -
 97
97 -
 98
98 -
 99
99 -
 100
100 -
 101
101 -
 102
102 -
 103
103 -
 104
104 -
 105
105 -
 106
106 -
 107
107 -
 108
108 -
109
-
110
-
111
-
112
-
113
-
114
-
115
-
116
-
117
-
118
-
119
-
120
-
121
-
122
-
123
-
124
-
125
-
126
-
127
-
128
-
129
-
130
-
131
-
132
-
133
-
134
-
135
-
136
-
137
-
138
-
139
-
140
-
141
-
142
-
143
-
144
-
145
-
146
-
147
-
148
-
149
-
150
-
151
-
152
-
153
-
154
-
155
-
156
-
157
-
158
-
159
-
160
-
161
-
162
-
163
-
164
-
165
-
166
-
167
-
168
-
169
-
170
-
171
-
172
-
173
-
174
-
175
-
176
-
177
-
178
-
179
-
180
-
181
-
182
-
183
-
184
-
185
-
186
-
187
-
188
-
189
-
190
-
191
-
192
-
193
-
194
-
195
-
196
-
197
-
198
-
199
-
200
-
201
-
202
-
203
-
204
-
205
-
206
-
207
-
208
-
209
-
210
-
211
-
212
-
213
-
214
-
215
-
216
-
217
-
218
-
219
-
220
-
221
-
222
-
223
-
224
-
225
-
226
-
227
-
228
-
229
-
230
-
231
-
232
-
233
-
234
-
235
-
236
 |
 |
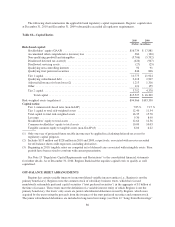
STOCKHOLDERS’ EQUITY
Stockholders’ equity decreased to $16.7 billion at year-end 2010 versus $17.9 billion at year-end 2009. In
2010, net losses reduced stockholders’ equity by $539 million, cash dividends declared reduced stockholders’
equity by $49 million for common stock and $187 million for preferred stock, and changes in accumulated other
comprehensive income decreased equity by $390 million.
On May 7, 2009, the final results of the Federal Reserve’s Supervisory Capital Assessment Program
(“SCAP”) were released requiring Regions to submit a capital plan to its regulators detailing the steps to be
utilized to increase total Tier 1 common equity by $2.5 billion, of which at least $0.4 billion had to be new Tier 1
equity (see Table 2 “GAAP to Non-GAAP Reconciliation” and Table 18 “Capital Ratios” for further discussion).
The Company’s public equity offering of common stock, announced May 20, 2009, resulted in the issuance
of 460 million shares at $4 per share, generating proceeds of approximately $1.8 billion, net of issuance costs.
The Company also issued 287,500 shares of mandatory convertible preferred stock, Series B (“Series B
shares”), generating net proceeds of approximately $278 million. Accrued dividends on the Series B shares
reduced retained earnings by $12 million and $19 million during 2010 and 2009, respectively. In November
2009, a single investor converted approximately 20,000 Series B shares to common shares as allowed under the
original transaction documents. On June 18, 2010, as allowed by the terms of the Series B shares, Regions
initiated an early conversion of all of the remaining outstanding Series B shares. Dividends accrued and unpaid at
the conversion date were settled through issuance of common shares in accordance with the original document.
No Series B shares were outstanding at December 31, 2010. Approximately 63 million common shares were
issued in the conversion and dividend settlement.
In addition to the offerings mentioned above, in 2009 the Company also exchanged approximately
33 million common shares for $202 million of outstanding 6.625 percent trust preferred securities issued by
Regions Financing Trust II (“the Trust”). The trust preferred securities were exchanged for junior subordinated
notes issued by the Company to the Trust. The Company recognized a pre-tax gain of approximately $61 million
on the extinguishment of the junior subordinated notes. The increase in shareholders’ equity related to the debt
for common share exchange was approximately $135 million, net of issuance costs.
These public offerings along with other capital raising efforts resulted in Regions fully meeting the Tier 1
common equity capital and exceeding the Tier 1 capital requirements prescribed by the SCAP (see Table 2
“GAAP to Non-GAAP Reconciliation” for further discussion).
At December 31, 2010, Regions had 23.1 million common shares available for repurchase through open
market transactions under an existing share repurchase authorization. There were no treasury stock purchases
through open market transactions during 2010 or 2009. The Company’s ability to repurchase its common stock is
limited by the terms of the Purchase Agreement between Regions and the U.S. Treasury entered into on
November 14, 2008, pursuant to the U.S. Treasury’s Capital Purchase Program (“CPP”). See Part II, Item 5
(“Market for Registrant’s Common Equity, Related Stockholder Matters and Issuer Purchases of Equity
Securities”) for more information.
Regions’ ratio of stockholders’ equity to total assets was 12.6 percent at both December 31, 2010 and
December 31, 2009. Regions’ ratio of tangible common stockholders’ equity (stockholders’ equity less goodwill
and other identifiable intangibles and the related deferred tax liability) to total tangible assets was 6.04 percent at
December 31, 2010 compared to 6.22 percent at December 31, 2009 (see Table 2 “GAAP to Non-GAAP
Reconciliation” for further discussion). The decrease between years was a result of the change in accumulated
other comprehensive income and the reduction in tangible assets.
In 2010, Regions decreased its annual dividend to $0.04 per common share, compared to $0.13 in 2009 and
$0.96 in 2008. Regions does not expect to increase its quarterly dividend above $0.01 per common share for the
foreseeable future.
84