Regions Bank 2010 Annual Report Download - page 207
Download and view the complete annual report
Please find page 207 of the 2010 Regions Bank annual report below. You can navigate through the pages in the report by either clicking on the pages listed below, or by using the keyword search tool below to find specific information within the annual report.-
 1
1 -
2
-
3
-
4
-
5
-
6
-
7
-
8
-
9
-
10
-
11
-
12
-
13
-
14
-
15
-
16
-
17
-
18
-
19
-
20
-
21
-
22
-
23
-
24
-
25
-
26
-
27
-
28
-
29
-
30
-
31
-
32
-
33
-
34
-
35
-
36
-
37
-
38
-
39
-
40
-
41
-
42
-
43
-
44
-
45
-
46
-
47
-
48
-
49
-
50
-
51
-
52
-
53
-
54
-
55
-
56
-
57
-
58
-
59
-
60
-
61
-
62
-
63
-
64
-
65
-
66
-
67
-
68
-
69
-
70
-
71
-
72
-
73
-
74
-
75
-
76
-
77
-
78
-
79
-
80
-
81
-
82
-
83
-
84
-
85
-
86
-
87
-
88
-
89
-
90
-
91
-
92
-
93
-
94
-
95
-
96
-
97
-
98
-
99
-
100
-
101
-
102
-
103
-
104
-
105
-
106
-
107
-
108
-
109
-
110
-
111
-
112
-
113
-
114
-
115
-
116
-
117
-
118
-
119
-
120
-
121
-
122
-
123
-
124
-
125
-
126
-
127
-
128
-
129
-
130
-
131
-
132
-
133
-
134
-
135
-
136
-
137
-
138
-
139
-
140
-
141
-
142
-
143
-
144
-
145
-
146
-
147
-
148
-
149
-
150
-
151
-
152
-
153
-
154
-
155
-
156
-
157
-
158
-
159
-
160
-
161
-
162
-
163
-
164
-
165
-
166
-
167
-
168
-
169
-
170
-
171
-
172
-
173
-
174
-
175
-
176
-
177
-
178
-
179
-
180
-
181
-
182
-
183
-
184
-
185
-
186
-
187
-
188
-
189
-
190
-
191
-
192
-
193
-
194
-
195
-
196
-
 197
197 -
 198
198 -
 199
199 -
 200
200 -
 201
201 -
 202
202 -
 203
203 -
 204
204 -
 205
205 -
 206
206 -
 207
207 -
 208
208 -
 209
209 -
 210
210 -
 211
211 -
 212
212 -
 213
213 -
 214
214 -
 215
215 -
 216
216 -
 217
217 -
218
-
219
-
220
-
221
-
222
-
223
-
224
-
225
-
226
-
227
-
228
-
229
-
230
-
231
-
232
-
233
-
234
-
235
-
236
 |
 |

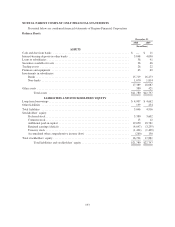
NOTE 24. PARENT COMPANY ONLY FINANCIAL STATEMENTS
Presented below are condensed financial statements of Regions Financial Corporation:
Balance Sheets
December 31
2010 2009
(In millions)
ASSETS
Cash and due from banks ..................................................... $ — $ 11
Interest-bearing deposits in other banks .......................................... 3,848 4,050
Loans to subsidiaries ......................................................... 36 91
Securities available for sale .................................................... 36 46
Trading assets .............................................................. 26 22
Premises and equipment ...................................................... 65 69
Investments in subsidiaries:
Banks ................................................................. 15,719 16,273
Non-banks ............................................................. 1,670 1,814
17,389 18,087
Other assets ................................................................ 380 421
Total assets ........................................................ $21,780 $22,797
LIABILITIES AND STOCKHOLDERS’ EQUITY
Long-term borrowings ........................................................ $ 4,907 $ 4,662
Other liabilities ............................................................. 139 254
Total liabilities ............................................................. 5,046 4,916
Stockholders’ equity:
Preferred stock .......................................................... 3,380 3,602
Common stock .......................................................... 13 12
Additional paid-in capital ................................................. 19,050 18,781
Retained earnings (deficit) ................................................ (4,047) (3,235)
Treasury stock .......................................................... (1,402) (1,409)
Accumulated other comprehensive income (loss) .............................. (260) 130
Total stockholders’ equity ..................................................... 16,734 17,881
Total liabilitites and stockholders’ equity ................................. $21,780 $22,797
193