Regions Bank 2010 Annual Report Download - page 94
Download and view the complete annual report
Please find page 94 of the 2010 Regions Bank annual report below. You can navigate through the pages in the report by either clicking on the pages listed below, or by using the keyword search tool below to find specific information within the annual report.-
 1
1 -
2
-
3
-
4
-
5
-
6
-
7
-
8
-
9
-
10
-
11
-
12
-
13
-
14
-
15
-
16
-
17
-
18
-
19
-
20
-
21
-
22
-
23
-
24
-
25
-
26
-
27
-
28
-
29
-
30
-
31
-
32
-
33
-
34
-
35
-
36
-
37
-
38
-
39
-
40
-
41
-
42
-
43
-
44
-
45
-
46
-
47
-
48
-
49
-
50
-
51
-
52
-
53
-
54
-
55
-
56
-
57
-
58
-
59
-
60
-
61
-
62
-
63
-
64
-
65
-
66
-
67
-
68
-
69
-
70
-
71
-
72
-
73
-
74
-
75
-
76
-
77
-
78
-
79
-
80
-
81
-
82
-
83
-
 84
84 -
 85
85 -
 86
86 -
 87
87 -
 88
88 -
 89
89 -
 90
90 -
 91
91 -
 92
92 -
 93
93 -
 94
94 -
 95
95 -
 96
96 -
 97
97 -
 98
98 -
 99
99 -
 100
100 -
 101
101 -
 102
102 -
 103
103 -
 104
104 -
105
-
106
-
107
-
108
-
109
-
110
-
111
-
112
-
113
-
114
-
115
-
116
-
117
-
118
-
119
-
120
-
121
-
122
-
123
-
124
-
125
-
126
-
127
-
128
-
129
-
130
-
131
-
132
-
133
-
134
-
135
-
136
-
137
-
138
-
139
-
140
-
141
-
142
-
143
-
144
-
145
-
146
-
147
-
148
-
149
-
150
-
151
-
152
-
153
-
154
-
155
-
156
-
157
-
158
-
159
-
160
-
161
-
162
-
163
-
164
-
165
-
166
-
167
-
168
-
169
-
170
-
171
-
172
-
173
-
174
-
175
-
176
-
177
-
178
-
179
-
180
-
181
-
182
-
183
-
184
-
185
-
186
-
187
-
188
-
189
-
190
-
191
-
192
-
193
-
194
-
195
-
196
-
197
-
198
-
199
-
200
-
201
-
202
-
203
-
204
-
205
-
206
-
207
-
208
-
209
-
210
-
211
-
212
-
213
-
214
-
215
-
216
-
217
-
218
-
219
-
220
-
221
-
222
-
223
-
224
-
225
-
226
-
227
-
228
-
229
-
230
-
231
-
232
-
233
-
234
-
235
-
236
 |
 |

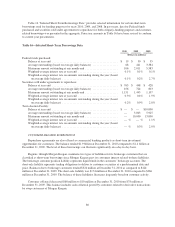
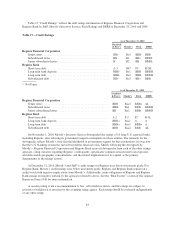
Table 16 “Selected Short-Term Borrowings Data” provides selected information for certain short-term
borrowings used for funding purposes for years 2010, 2009, and 2008. In past years, data for Federal funds
purchased and securities sold under agreements to repurchase for both company-funding purposes and customer-
related borrowings was presented in the aggregate. Prior year amounts in Table 16 have been revised to conform
to current year presentation.
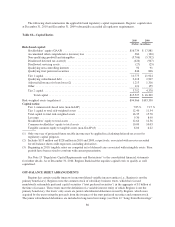
Table 16—Selected Short-Term Borrowings Data
2010 2009 2008
(Dollars in millions)
Federal funds purchased:
Balance at year end .............................................. $ 19 $ 30 $ 35
Average outstanding (based on average daily balances) .................. 68 441 3,384
Maximum amount outstanding at any month-end ....................... 106 2,011 5,583
Weighted-average interest rate at year end ............................ 0.1% 0.1% 0.1%
Weighted-average interest rate on amounts outstanding during the year (based
on average daily balances) ....................................... 0.1% 0.2% 2.7%
Securities sold under agreements to repurchase:
Balance at year end .............................................. $ 763 $ 448 $ 428
Average outstanding (based on average daily balances) .................. 456 724 803
Maximum amount outstanding at any month-end ....................... 1,151 1,445 1,107
Weighted-average interest rate at year end ............................ 0.3% 0.4% 1.9%
Weighted-average interest rate on amounts outstanding during the year (based
on average daily balances) ....................................... 0.2% 0.9% 2.8%
Term Auction Facility:
Balance at year end .............................................. $ — $ — $10,000
Average outstanding (based on average daily balances) .................. — 3,003 5,925
Maximum amount outstanding at any month-end ....................... — 10,000 13,000
Weighted-average interest rate at year end ............................ — % — % 1.1%
Weighted-average interest rate on amounts outstanding during the year (based
on average daily balances) ....................................... — % 0.3% 2.0%
CUSTOMER-RELATED BORROWINGS
Repurchase agreements are also offered as commercial banking products as short-term investment
opportunities for customers. The balance totaled $1.9 billion at December 31, 2010 compared to $1.4 billion at
December 31, 2009. The level of these borrowings can fluctuate significantly on a day-to-day basis.
Regions, through Morgan Keegan, maintains two types of liabilities for its brokerage customers that are
classified as short-term borrowings since Morgan Keegan pays its customers interest related to these liabilities.
The brokerage customer position liability represents liquid funds in the customers’ brokerage accounts. The
short-sale liability represents trading obligations to deliver to customers securities at a predetermined date and
price. Balances due to brokerage customers totaled $324 million at December 31, 2010 as compared to $424
million at December 31, 2009. The short-sale liability was $174 million at December 31, 2010 compared to $266
million at December 31, 2009. The balance of these liabilities fluctuates frequently based on customer activity.
Customer collateral decreased $68 million to $10 million at December 31, 2010 from $78 million at
December 31, 2009. This balance includes cash collateral posted by customers related to derivative transactions
by swap customers of Morgan Keegan.
80