Regions Bank 2010 Annual Report Download - page 76
Download and view the complete annual report
Please find page 76 of the 2010 Regions Bank annual report below. You can navigate through the pages in the report by either clicking on the pages listed below, or by using the keyword search tool below to find specific information within the annual report.-
 1
1 -
2
-
3
-
4
-
5
-
6
-
7
-
8
-
9
-
10
-
11
-
12
-
13
-
14
-
15
-
16
-
17
-
18
-
19
-
20
-
21
-
22
-
23
-
24
-
25
-
26
-
27
-
28
-
29
-
30
-
31
-
32
-
33
-
34
-
35
-
36
-
37
-
38
-
39
-
40
-
41
-
42
-
43
-
44
-
45
-
46
-
47
-
48
-
49
-
50
-
51
-
52
-
53
-
54
-
55
-
56
-
57
-
58
-
59
-
60
-
61
-
62
-
63
-
64
-
65
-
 66
66 -
 67
67 -
 68
68 -
 69
69 -
 70
70 -
 71
71 -
 72
72 -
 73
73 -
 74
74 -
 75
75 -
 76
76 -
 77
77 -
 78
78 -
 79
79 -
 80
80 -
 81
81 -
 82
82 -
 83
83 -
 84
84 -
 85
85 -
 86
86 -
87
-
88
-
89
-
90
-
91
-
92
-
93
-
94
-
95
-
96
-
97
-
98
-
99
-
100
-
101
-
102
-
103
-
104
-
105
-
106
-
107
-
108
-
109
-
110
-
111
-
112
-
113
-
114
-
115
-
116
-
117
-
118
-
119
-
120
-
121
-
122
-
123
-
124
-
125
-
126
-
127
-
128
-
129
-
130
-
131
-
132
-
133
-
134
-
135
-
136
-
137
-
138
-
139
-
140
-
141
-
142
-
143
-
144
-
145
-
146
-
147
-
148
-
149
-
150
-
151
-
152
-
153
-
154
-
155
-
156
-
157
-
158
-
159
-
160
-
161
-
162
-
163
-
164
-
165
-
166
-
167
-
168
-
169
-
170
-
171
-
172
-
173
-
174
-
175
-
176
-
177
-
178
-
179
-
180
-
181
-
182
-
183
-
184
-
185
-
186
-
187
-
188
-
189
-
190
-
191
-
192
-
193
-
194
-
195
-
196
-
197
-
198
-
199
-
200
-
201
-
202
-
203
-
204
-
205
-
206
-
207
-
208
-
209
-
210
-
211
-
212
-
213
-
214
-
215
-
216
-
217
-
218
-
219
-
220
-
221
-
222
-
223
-
224
-
225
-
226
-
227
-
228
-
229
-
230
-
231
-
232
-
233
-
234
-
235
-
236
 |
 |

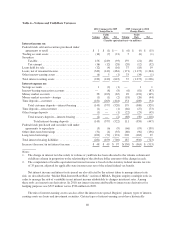
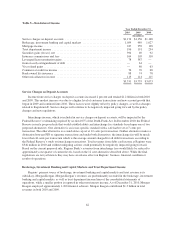
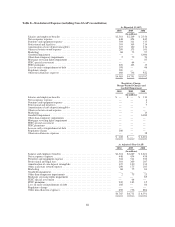
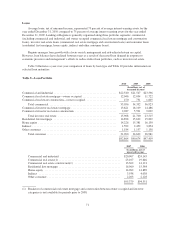
Table 5—Non-Interest Income
Year Ended December 31
2010 2009 2008
(In millions)
Service charges on deposit accounts ....................................... $1,174 $1,156 $1,148
Brokerage, investment banking and capital markets ........................... 1,059 989 1,027
Mortgage income ...................................................... 247 259 138
Trust department income ................................................ 196 191 234
Securities gains (losses), net ............................................. 394 69 92
Insurance commissions and fees .......................................... 104 105 110
Leveraged lease termination gains ......................................... 78 587 —
Gain on early extinguishment of debt ...................................... — 61 —
Visa-related gains ...................................................... — 80 63
Commercial credit fee income ............................................ 76 70 68
Bank-owned life insurance ............................................... 88 74 78
Other miscellaneous income ............................................. 115 114 115
$3,531 $3,755 $3,073
Service Charges on Deposit Accounts
Income from service charges on deposit accounts increased 2 percent and totaled $1.2 billion in both 2010
and 2009. This modest increase was due to a higher level of customer transactions and new account growth that
began in 2009 and continued into 2010. These factors were slightly offset by policy changes, as well as changes
related to Regulation E. Service charges will continue to be negatively impacted going forward by the policy
changes and new regulations.
Interchange income, which is included in service charges on deposit accounts, will be impacted by the
Federal Reserve’s rulemaking required by section 1075 of the Dodd-Frank Act. In December 2010, the Federal
Reserve issued a proposed rule that would establish debit card interchange fee standards based upon one of two
proposed alternatives. One alternative is an issuer-specific standard with a safe harbor set at 7 cents per
transaction. The other alternative is a stand-alone cap set at 12 cents per transaction. Neither alternative makes a
distinction between PIN or signature transactions and under both alternatives, the interchange fee will be much
lower than 44 cents per transaction which is the average amount charged for all debit transactions according to
the Federal Reserve’s study on interchange transactions. Total revenues from debit card income at Regions were
$346 million in 2010 and without mitigating actions could potentially be negatively impacted going forward.
Based on the current proposed rule, Regions Bank’s revenues from interchange fees would likely be reduced to
approximately one quarter of current levels, based on the 12 cent alternative described above. While the final
regulations are not yet known, they may have an adverse affect on Regions’ business, financial condition or
results of operations.
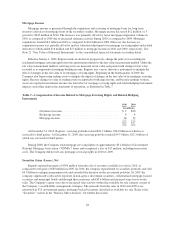
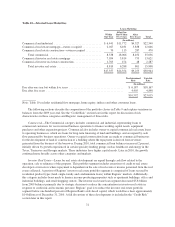
Brokerage, Investment Banking and Capital Markets and Trust Department Income
Regions’ primary source of brokerage, investment banking and capital markets and trust revenue is its
subsidiary, Morgan Keegan. Morgan Keegan’s revenues are predominantly recorded in the brokerage, investment
banking and capital markets, as well as trust department income lines of the consolidated statements of
operations, while a smaller portion is reported in other non-interest income. As of December 31, 2010, Morgan
Keegan employed approximately 1,200 financial advisors. Morgan Keegan contributed $1.3 billion in total
revenues in both 2010 and 2009.
62