Regions Bank 2010 Annual Report Download - page 122
Download and view the complete annual report
Please find page 122 of the 2010 Regions Bank annual report below. You can navigate through the pages in the report by either clicking on the pages listed below, or by using the keyword search tool below to find specific information within the annual report.-
 1
1 -
2
-
3
-
4
-
5
-
6
-
7
-
8
-
9
-
10
-
11
-
12
-
13
-
14
-
15
-
16
-
17
-
18
-
19
-
20
-
21
-
22
-
23
-
24
-
25
-
26
-
27
-
28
-
29
-
30
-
31
-
32
-
33
-
34
-
35
-
36
-
37
-
38
-
39
-
40
-
41
-
42
-
43
-
44
-
45
-
46
-
47
-
48
-
49
-
50
-
51
-
52
-
53
-
54
-
55
-
56
-
57
-
58
-
59
-
60
-
61
-
62
-
63
-
64
-
65
-
66
-
67
-
68
-
69
-
70
-
71
-
72
-
73
-
74
-
75
-
76
-
77
-
78
-
79
-
80
-
81
-
82
-
83
-
84
-
85
-
86
-
87
-
88
-
89
-
90
-
91
-
92
-
93
-
94
-
95
-
96
-
97
-
98
-
99
-
100
-
101
-
102
-
103
-
104
-
105
-
106
-
107
-
108
-
109
-
110
-
111
-
 112
112 -
 113
113 -
 114
114 -
 115
115 -
 116
116 -
 117
117 -
 118
118 -
 119
119 -
 120
120 -
 121
121 -
 122
122 -
 123
123 -
 124
124 -
 125
125 -
 126
126 -
 127
127 -
 128
128 -
 129
129 -
 130
130 -
 131
131 -
 132
132 -
133
-
134
-
135
-
136
-
137
-
138
-
139
-
140
-
141
-
142
-
143
-
144
-
145
-
146
-
147
-
148
-
149
-
150
-
151
-
152
-
153
-
154
-
155
-
156
-
157
-
158
-
159
-
160
-
161
-
162
-
163
-
164
-
165
-
166
-
167
-
168
-
169
-
170
-
171
-
172
-
173
-
174
-
175
-
176
-
177
-
178
-
179
-
180
-
181
-
182
-
183
-
184
-
185
-
186
-
187
-
188
-
189
-
190
-
191
-
192
-
193
-
194
-
195
-
196
-
197
-
198
-
199
-
200
-
201
-
202
-
203
-
204
-
205
-
206
-
207
-
208
-
209
-
210
-
211
-
212
-
213
-
214
-
215
-
216
-
217
-
218
-
219
-
220
-
221
-
222
-
223
-
224
-
225
-
226
-
227
-
228
-
229
-
230
-
231
-
232
-
233
-
234
-
235
-
236
 |
 |

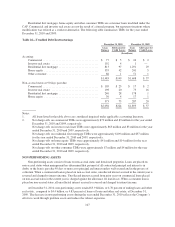
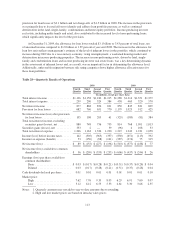
Foreclosed properties, a subset of non-performing assets, totaled $454 million at December 31, 2010 and
$607 million at December 31, 2009, reflecting dispositions and valuation charges due to continued stress on
property values. Regions’ foreclosed properties are composed primarily of a number of small to medium-size
properties that are diversified geographically throughout the franchise. Foreclosed properties are recorded at the
lower of the recorded investment in the loan or fair value less the estimated cost to sell. Table 27 “Non-
Performing Assets” presents information on non-performing loans and foreclosed properties acquired in
settlement of loans.
Management expects non-performing assets to stabilize going forward, but will likely remain elevated as
compared to historical levels. Economic trends such as real estate valuations and unemployment will impact the
future level of non-performing assets.
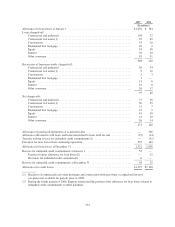
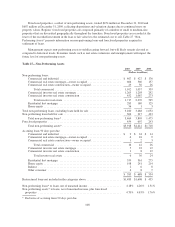
Table 27—Non-Performing Assets
2010 2009 2008
(Dollars in millions)
Non-performing loans:
Commercial and industrial ........................................... $ 467 $ 427 $ 176
Commercial real estate mortgage—owner occupied ....................... 606 560 157
Commercial real estate construction—owner occupied ..................... 29 50 26
Total commercial .............................................. 1,102 1,037 359
Commercial investor real estate mortgage ............................... 1,265 1,203 292
Commercial investor real estate construction ............................ 452 1,067 273
Total investor real estate ........................................ 1,717 2,270 565
Residential first mortgage ........................................... 285 180 125
Home equity ...................................................... 56 1 3
Total non-performing loans, excluding loans held for sale ...................... 3,160 3,488 1,052
Non-performing loans held for sale ........................................ 304 317 423
Total non-performing loans* ......................................... 3,464 3,805 1,475
Foreclosed properties ................................................... 454 607 243
Total non-performing assets* ......................................... $3,918 $4,412 $1,718
Accruing loans 90 days past due:
Commercial and industrial ........................................... $ 9 $ 24 $ 14
Commercial real estate mortgage—owner occupied ....................... 6 16 9
Commercial real estate construction—owner occupied .....................123
Total commercial .............................................. 16 42 26
Commercial investor real estate mortgage ............................... 5 22 12
Commercial investor real estate construction ............................ 1 8 12
Total investor real estate ........................................ 6 30 24
Residential first mortgage ........................................... 359 361 275
Home equity ...................................................... 198 241 214
Indirect ..........................................................268
Other consumer ...................................................487
$ 585 $ 688 $ 554
Restructured loans not included in the categories above ........................ $1,483 $1,608 $ 455
Non-performing loans* to loans, net of unearned income ....................... 4.18% 4.20% 1.51%
Non-performing assets* to loans, net of unearned income, plus foreclosed
properties .......................................................... 4.70% 4.83% 1.76%
* Exclusive of accruing loans 90 days past due
108