Regions Bank 2010 Annual Report Download - page 159
Download and view the complete annual report
Please find page 159 of the 2010 Regions Bank annual report below. You can navigate through the pages in the report by either clicking on the pages listed below, or by using the keyword search tool below to find specific information within the annual report.-
 1
1 -
2
-
3
-
4
-
5
-
6
-
7
-
8
-
9
-
10
-
11
-
12
-
13
-
14
-
15
-
16
-
17
-
18
-
19
-
20
-
21
-
22
-
23
-
24
-
25
-
26
-
27
-
28
-
29
-
30
-
31
-
32
-
33
-
34
-
35
-
36
-
37
-
38
-
39
-
40
-
41
-
42
-
43
-
44
-
45
-
46
-
47
-
48
-
49
-
50
-
51
-
52
-
53
-
54
-
55
-
56
-
57
-
58
-
59
-
60
-
61
-
62
-
63
-
64
-
65
-
66
-
67
-
68
-
69
-
70
-
71
-
72
-
73
-
74
-
75
-
76
-
77
-
78
-
79
-
80
-
81
-
82
-
83
-
84
-
85
-
86
-
87
-
88
-
89
-
90
-
91
-
92
-
93
-
94
-
95
-
96
-
97
-
98
-
99
-
100
-
101
-
102
-
103
-
104
-
105
-
106
-
107
-
108
-
109
-
110
-
111
-
112
-
113
-
114
-
115
-
116
-
117
-
118
-
119
-
120
-
121
-
122
-
123
-
124
-
125
-
126
-
127
-
128
-
129
-
130
-
131
-
132
-
133
-
134
-
135
-
136
-
137
-
138
-
139
-
140
-
141
-
142
-
143
-
144
-
145
-
146
-
147
-
148
-
 149
149 -
 150
150 -
 151
151 -
 152
152 -
 153
153 -
 154
154 -
 155
155 -
 156
156 -
 157
157 -
 158
158 -
 159
159 -
 160
160 -
 161
161 -
 162
162 -
 163
163 -
 164
164 -
 165
165 -
 166
166 -
 167
167 -
 168
168 -
 169
169 -
170
-
171
-
172
-
173
-
174
-
175
-
176
-
177
-
178
-
179
-
180
-
181
-
182
-
183
-
184
-
185
-
186
-
187
-
188
-
189
-
190
-
191
-
192
-
193
-
194
-
195
-
196
-
197
-
198
-
199
-
200
-
201
-
202
-
203
-
204
-
205
-
206
-
207
-
208
-
209
-
210
-
211
-
212
-
213
-
214
-
215
-
216
-
217
-
218
-
219
-
220
-
221
-
222
-
223
-
224
-
225
-
226
-
227
-
228
-
229
-
230
-
231
-
232
-
233
-
234
-
235
-
236
 |
 |

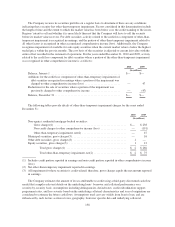
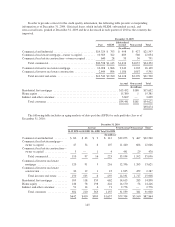
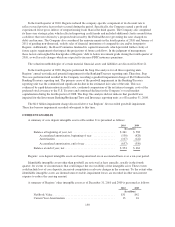
In order to provide context for the credit quality information, the following table presents corresponding
information as of December 31, 2009. Criticized loans, which include OLEM, substandard accrual, and
non-accrual loans, peaked at December 31, 2009 and have decreased in each quarter of 2010 as the economy has
improved.
December 31, 2009
Pass OLEM
Substandard
Accrual Non-accrual Total
(In millions)
Commercial and industrial ............................. $19,329 $ 793 $ 998 $ 427 $21,547
Commercial real estate mortgage—owner occupied ......... 10,569 322 603 560 12,054
Commercial real estate construction—owner occupied ...... 640 28 33 50 751
Total commercial ................................ $30,538 $1,143 $1,634 $1,037 $34,352
Commercial investor real estate mortgage ................ 10,098 1,866 2,942 1,203 16,109
Commercial investor real estate construction .............. 2,444 894 1,186 1,067 5,591
Total investor real estate .......................... $12,542 $2,760 $4,128 $2,270 $21,700
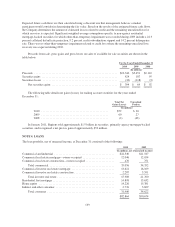
Accrual Non-accrual Total
(In millions)
Residential first mortgage ............................................. $15,452 $180 $15,632
Home equity ........................................................ 15,380 1 15,381
Indirect and other consumer ............................................ 3,609 — 3,609
Total consumer .................................................. $34,441 $181 $34,622
$90,674
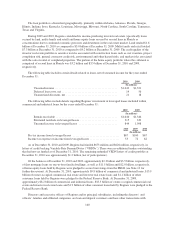
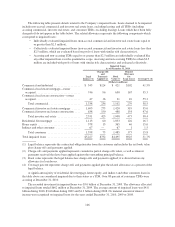
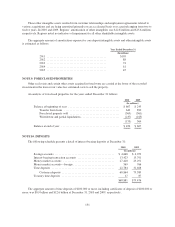
The following table includes an aging analysis of days past due (DPD) for each portfolio class as of
December 31, 2010:
December 31, 2010
Accrual Total Accrual Non-accrual Total
30-59 DPD 60-89 DPD 90+ DPD Total 30+ DPD
(In millions)
Commercial and industrial ......... $ 60 $ 43 $ 9 $ 112 $22,073 $ 467 $22,540
Commercial real estate mortgage—
owner occupied ................ 47 54 6 107 11,440 606 12,046
Commercial real estate construction—
owner occupied ................ 3 — 1 4 441 29 470
Total commercial ............. 110 97 16 223 33,954 1,102 35,056
Commercial investor real estate
mortgage ..................... 120 91 5 216 12,356 1,265 13,621
Commercial investor real estate
construction ................... 30 12 1 43 1,835 452 2,287
Total investor real estate ....... 150 103 6 259 14,191 1,717 15,908
Residential first mortgage .......... 185 118 359 662 14,613 285 14,898
Home equity .................... 146 78 198 422 14,170 56 14,226
Indirect and other consumer ........ 51 14 6 71 2,776 — 2,776
Total consumer .............. 382 210 563 1,155 31,559 341 31,900
$642 $410 $585 $1,637 $79,704 $3,160 $82,864
145