Regions Bank 2010 Annual Report Download - page 101
Download and view the complete annual report
Please find page 101 of the 2010 Regions Bank annual report below. You can navigate through the pages in the report by either clicking on the pages listed below, or by using the keyword search tool below to find specific information within the annual report.-
 1
1 -
2
-
3
-
4
-
5
-
6
-
7
-
8
-
9
-
10
-
11
-
12
-
13
-
14
-
15
-
16
-
17
-
18
-
19
-
20
-
21
-
22
-
23
-
24
-
25
-
26
-
27
-
28
-
29
-
30
-
31
-
32
-
33
-
34
-
35
-
36
-
37
-
38
-
39
-
40
-
41
-
42
-
43
-
44
-
45
-
46
-
47
-
48
-
49
-
50
-
51
-
52
-
53
-
54
-
55
-
56
-
57
-
58
-
59
-
60
-
61
-
62
-
63
-
64
-
65
-
66
-
67
-
68
-
69
-
70
-
71
-
72
-
73
-
74
-
75
-
76
-
77
-
78
-
79
-
80
-
81
-
82
-
83
-
84
-
85
-
86
-
87
-
88
-
89
-
90
-
 91
91 -
 92
92 -
 93
93 -
 94
94 -
 95
95 -
 96
96 -
 97
97 -
 98
98 -
 99
99 -
 100
100 -
 101
101 -
 102
102 -
 103
103 -
 104
104 -
 105
105 -
 106
106 -
 107
107 -
 108
108 -
 109
109 -
 110
110 -
 111
111 -
112
-
113
-
114
-
115
-
116
-
117
-
118
-
119
-
120
-
121
-
122
-
123
-
124
-
125
-
126
-
127
-
128
-
129
-
130
-
131
-
132
-
133
-
134
-
135
-
136
-
137
-
138
-
139
-
140
-
141
-
142
-
143
-
144
-
145
-
146
-
147
-
148
-
149
-
150
-
151
-
152
-
153
-
154
-
155
-
156
-
157
-
158
-
159
-
160
-
161
-
162
-
163
-
164
-
165
-
166
-
167
-
168
-
169
-
170
-
171
-
172
-
173
-
174
-
175
-
176
-
177
-
178
-
179
-
180
-
181
-
182
-
183
-
184
-
185
-
186
-
187
-
188
-
189
-
190
-
191
-
192
-
193
-
194
-
195
-
196
-
197
-
198
-
199
-
200
-
201
-
202
-
203
-
204
-
205
-
206
-
207
-
208
-
209
-
210
-
211
-
212
-
213
-
214
-
215
-
216
-
217
-
218
-
219
-
220
-
221
-
222
-
223
-
224
-
225
-
226
-
227
-
228
-
229
-
230
-
231
-
232
-
233
-
234
-
235
-
236
 |
 |
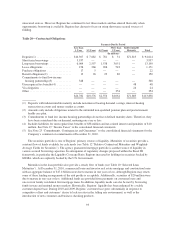
to the consolidated financial statements) and Regions’ equity interests in the business trusts are included in other
assets. For regulatory reporting and capital adequacy purposes, the Federal Reserve Board has indicated that such
trust preferred securities will continue to constitute Tier 1 capital. Additional discussion regarding the status of
capital treatment for these instruments is included in the “Supervision and Regulation—Capital Requirements”
section of Item 1 of this Annual Report on Form 10-K.
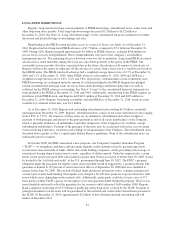
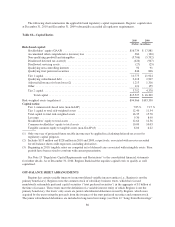
Also, Regions periodically invests in various limited partnerships that sponsor affordable housing projects,
which are funded through a combination of debt and equity. Regions’ maximum exposure to loss as of
December 31, 2010 was $893 million, which included $196 million in unfunded commitments to the
partnerships. Additionally, Regions has short-term construction loans or letters of credit commitments with the
partnerships totaling $213 million as of December 31, 2010. The funded portion of these loans and letters of
credit was $61 million at December 31, 2010. The funded portion is included with loans on the consolidated
balance sheets. See Note 2 “Variable Interest Entities” to the consolidated financial statements for further
discussion.
EFFECTS OF INFLATION
The majority of assets and liabilities of a financial institution are monetary in nature; therefore, a financial
institution differs greatly from most commercial and industrial companies, which have significant investments in
fixed assets or inventories that are greatly impacted by inflation. However, inflation does have an important
impact on the growth of total assets in the banking industry and the resulting need to increase equity capital at
higher than normal rates in order to maintain an appropriate equity-to-assets ratio. Inflation also affects other
expenses that tend to rise during periods of general inflation.
Management believes the most significant potential impact of inflation on financial results is a direct result
of Regions’ ability to manage the impact of changes in interest rates. Management attempts to maintain an
essentially balanced position between rate-sensitive assets and liabilities in order to minimize the impact of
interest rate fluctuations on net interest income. However, this goal can be difficult to completely achieve in
times of rapidly changing rate structure and is one of many factors considered in determining the company’s
interest rate positioning. The Company is asset sensitive as of December 31, 2010. Refer to Table 19 “Interest
Rate Sensitivity” for additional details on Regions’ interest rate sensitivity.
EFFECTS OF DEFLATION
A period of deflation would affect all industries, including financial institutions. Potentially, deflation could
lead to lower profits, higher unemployment, lower production and deterioration in overall economic conditions.
In addition, deflation could depress economic activity and impair bank earnings through increasing the value of
debt while decreasing the value of collateral for loans. If the economy experienced a severe period of deflation,
then it could depress loan demand, impair the ability of borrowers to repay loans and sharply reduce bank
earnings.
Management believes the most significant potential impact of deflation on financial results is a direct result
of Regions’ ability to maintain a high amount of capital to cushion against future losses. In addition, the
Company can utilize certain risk management tools to help the bank maintain its balance sheet strength even if a
deflationary scenario were to develop.
RISK MANAGEMENT
Risk identification and risk management are key elements in the overall management of Regions.
Management believes the primary risk exposures are market risk, liquidity risk, counterparty risk and credit risk.
Market risk is the price and earnings variability (mainly reductions) arising from adverse changes in 1) the fair
values of financial instruments due to changes in interest rates, exchange rates, commodity prices, equity prices
87