Regions Bank 2010 Annual Report Download - page 90
Download and view the complete annual report
Please find page 90 of the 2010 Regions Bank annual report below. You can navigate through the pages in the report by either clicking on the pages listed below, or by using the keyword search tool below to find specific information within the annual report.-
 1
1 -
2
-
3
-
4
-
5
-
6
-
7
-
8
-
9
-
10
-
11
-
12
-
13
-
14
-
15
-
16
-
17
-
18
-
19
-
20
-
21
-
22
-
23
-
24
-
25
-
26
-
27
-
28
-
29
-
30
-
31
-
32
-
33
-
34
-
35
-
36
-
37
-
38
-
39
-
40
-
41
-
42
-
43
-
44
-
45
-
46
-
47
-
48
-
49
-
50
-
51
-
52
-
53
-
54
-
55
-
56
-
57
-
58
-
59
-
60
-
61
-
62
-
63
-
64
-
65
-
66
-
67
-
68
-
69
-
70
-
71
-
72
-
73
-
74
-
75
-
76
-
77
-
78
-
79
-
 80
80 -
 81
81 -
 82
82 -
 83
83 -
 84
84 -
 85
85 -
 86
86 -
 87
87 -
 88
88 -
 89
89 -
 90
90 -
 91
91 -
 92
92 -
 93
93 -
 94
94 -
 95
95 -
 96
96 -
 97
97 -
 98
98 -
 99
99 -
 100
100 -
101
-
102
-
103
-
104
-
105
-
106
-
107
-
108
-
109
-
110
-
111
-
112
-
113
-
114
-
115
-
116
-
117
-
118
-
119
-
120
-
121
-
122
-
123
-
124
-
125
-
126
-
127
-
128
-
129
-
130
-
131
-
132
-
133
-
134
-
135
-
136
-
137
-
138
-
139
-
140
-
141
-
142
-
143
-
144
-
145
-
146
-
147
-
148
-
149
-
150
-
151
-
152
-
153
-
154
-
155
-
156
-
157
-
158
-
159
-
160
-
161
-
162
-
163
-
164
-
165
-
166
-
167
-
168
-
169
-
170
-
171
-
172
-
173
-
174
-
175
-
176
-
177
-
178
-
179
-
180
-
181
-
182
-
183
-
184
-
185
-
186
-
187
-
188
-
189
-
190
-
191
-
192
-
193
-
194
-
195
-
196
-
197
-
198
-
199
-
200
-
201
-
202
-
203
-
204
-
205
-
206
-
207
-
208
-
209
-
210
-
211
-
212
-
213
-
214
-
215
-
216
-
217
-
218
-
219
-
220
-
221
-
222
-
223
-
224
-
225
-
226
-
227
-
228
-
229
-
230
-
231
-
232
-
233
-
234
-
235
-
236
 |
 |

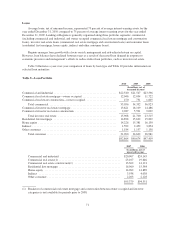
Government or government sponsored agencies, or which are not rated represented less than one percent of total
securities at year-end 2010. During 2009, due to the potential for downside price risk, the Company substantially
eliminated its exposure in non-agency commercial mortgage-backed securities, non-agency residential mortgage-
backed securities and municipal bonds. This was done in order to reduce credit risk within the portfolio. Regions
increased its liquidity availability by reinvesting the proceeds in agency securities, including securities backed by
GNMA.
Cash and Cash Equivalents
Cash and cash equivalents include cash and due from banks, interest-bearing deposits in other banks
(including the Federal Reserve Bank), and Federal funds sold and securities purchased under agreements to resell
(which have a life of 90 days or less). At December 31, 2010, these assets totaled $6.9 billion as compared to
$8.0 billion at December 31, 2009. The year-over-year decrease was primarily driven by a reduction in Regions’
interest-bearing deposits in other banks, primarily lower balances in its Federal Reserve Bank account.
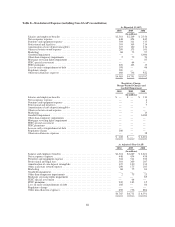
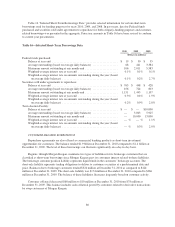
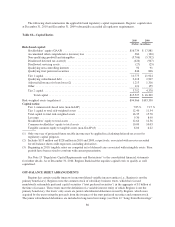
Trading Account Assets
Trading account assets decreased $1.9 billion to $1.1 billion at December 31, 2010. The trading account
assets are primarily held at Morgan Keegan. Also included in trading account assets are securities held in rabbi
trusts related to deferred compensation plans. Trading account assets are carried at market value with changes in
market value reflected in the consolidated statements of operations. At the end of 2009, Regions increased
holdings of U.S. Treasury and Federal agency securities held for the purpose of hedging mortgage servicing
rights (see Table 7 “Impact of Mortgage Servicing Rights and Related Hedging Instruments” for further
discussion). The Company exited these positions in early 2010, driving the decrease in trading account assets.
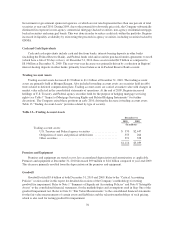
Table 13 “Trading Account Assets” provides a detail by type of security.
Table 13—Trading Account Assets
December 31
2010 2009
(In millions)
Trading account assets:
U.S. Treasury and Federal agency securities .................. $ 370 $2,447
Obligations of states and political subdivisions ................ 355 264
Other securities ......................................... 391 328
$1,116 $3,039
Premises and Equipment
Premises and equipment are stated at cost, less accumulated depreciation and amortization, as applicable.
Premises and equipment at December 31, 2010 decreased $99 million to $2.6 billion compared to year-end 2009.
This decrease primarily resulted from the depreciation on the premises and equipment.
Goodwill
Goodwill totaled $5.6 billion at both December 31, 2010 and 2009. Refer to the “Critical Accounting
Policies” section earlier in this report for detailed discussions of the Company’s methodology for testing
goodwill for impairment. Refer to Note 1 “Summary of Significant Accounting Policies” and Note 8 “Intangible
Assets” to the consolidated financial statements, for the methodologies and assumptions used in Step One of the
goodwill impairment test. Refer to Note 21 “Fair Value Measurements” to the consolidated financial statements,
for the fair value measurements of certain assets and liabilities and the valuation methodology of such pricing,
which is also used for testing goodwill for impairment.
76