Regions Bank 2010 Annual Report Download - page 158
Download and view the complete annual report
Please find page 158 of the 2010 Regions Bank annual report below. You can navigate through the pages in the report by either clicking on the pages listed below, or by using the keyword search tool below to find specific information within the annual report.-
 1
1 -
2
-
3
-
4
-
5
-
6
-
7
-
8
-
9
-
10
-
11
-
12
-
13
-
14
-
15
-
16
-
17
-
18
-
19
-
20
-
21
-
22
-
23
-
24
-
25
-
26
-
27
-
28
-
29
-
30
-
31
-
32
-
33
-
34
-
35
-
36
-
37
-
38
-
39
-
40
-
41
-
42
-
43
-
44
-
45
-
46
-
47
-
48
-
49
-
50
-
51
-
52
-
53
-
54
-
55
-
56
-
57
-
58
-
59
-
60
-
61
-
62
-
63
-
64
-
65
-
66
-
67
-
68
-
69
-
70
-
71
-
72
-
73
-
74
-
75
-
76
-
77
-
78
-
79
-
80
-
81
-
82
-
83
-
84
-
85
-
86
-
87
-
88
-
89
-
90
-
91
-
92
-
93
-
94
-
95
-
96
-
97
-
98
-
99
-
100
-
101
-
102
-
103
-
104
-
105
-
106
-
107
-
108
-
109
-
110
-
111
-
112
-
113
-
114
-
115
-
116
-
117
-
118
-
119
-
120
-
121
-
122
-
123
-
124
-
125
-
126
-
127
-
128
-
129
-
130
-
131
-
132
-
133
-
134
-
135
-
136
-
137
-
138
-
139
-
140
-
141
-
142
-
143
-
144
-
145
-
146
-
147
-
 148
148 -
 149
149 -
 150
150 -
 151
151 -
 152
152 -
 153
153 -
 154
154 -
 155
155 -
 156
156 -
 157
157 -
 158
158 -
 159
159 -
 160
160 -
 161
161 -
 162
162 -
 163
163 -
 164
164 -
 165
165 -
 166
166 -
 167
167 -
 168
168 -
169
-
170
-
171
-
172
-
173
-
174
-
175
-
176
-
177
-
178
-
179
-
180
-
181
-
182
-
183
-
184
-
185
-
186
-
187
-
188
-
189
-
190
-
191
-
192
-
193
-
194
-
195
-
196
-
197
-
198
-
199
-
200
-
201
-
202
-
203
-
204
-
205
-
206
-
207
-
208
-
209
-
210
-
211
-
212
-
213
-
214
-
215
-
216
-
217
-
218
-
219
-
220
-
221
-
222
-
223
-
224
-
225
-
226
-
227
-
228
-
229
-
230
-
231
-
232
-
233
-
234
-
235
-
236
 |
 |

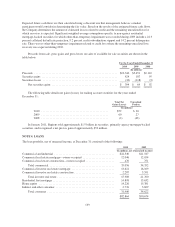
customers to borrow against the equity in their home. Real estate market values as of the time the loan or line is
secured directly affect the amount of credit extended and, in addition, changes in these values impact the depth of
potential losses. Indirect lending, which is lending initiated through third-party business partners, is largely
comprised of loans made through automotive dealerships. Other consumer loans include direct consumer
installment loans, overdrafts and other revolving credit, and educational loans. Loans in this portfolio segment
are sensitive to unemployment and other key consumer economic measures.
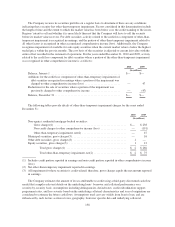
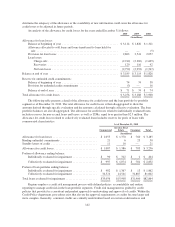
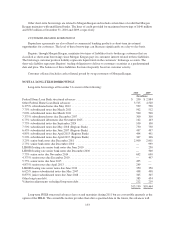
The following table presents credit quality indicators for the loan portfolio segments and classes, excluding
loans held for sale. Commercial and investor real estate loan classes are detailed by categories related to
underlying credit quality and probability of default. These categories are utilized to develop the associated
allowance for credit losses using historical losses adjusted for current economic conditions and are defined as
follows:
• Pass—includes obligations where the probability of default is considered low;
• Other Loans Especially Mentioned (“OLEM”)—includes obligations that have potential weakness
which may, if not reversed or corrected, weaken the credit or inadequately protect the Company’s
position at some future date. Obligations in this category may also be subject to economic or market
conditions which may, in the future, have an adverse affect on debt service ability;
• Substandard Accrual—includes obligations that exhibit a well-defined weakness which presently
jeopardizes debt repayment, even though they are currently performing. These obligations are
characterized by the distinct possibility that the Company may incur a loss in the future if these
weaknesses are not corrected;
• Non-accrual—includes obligations where management has determined that full payment of principal
and interest is in doubt.
Classes in the consumer portfolio segment are disaggregated by accrual status. Consumer loans are charged
down to estimated value and placed on non-accrual status based on period of delinquency, unless the loan is well-
secured and in process of collection. The associated allowance for credit losses is generally based on historical
losses of the various classes adjusted for current economic conditions.
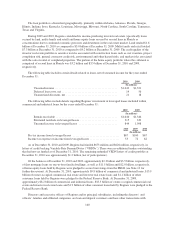
December 31, 2010
Pass OLEM
Substandard
Accrual Non-accrual Total
(In millions)
Commercial and industrial ........................ $20,764 $ 517 $ 792 $ 467 $22,540
Commercial real estate mortgage—owner occupied .... 10,344 283 813 606 12,046
Commercial real estate construction—owner
occupied .................................... 393 25 23 29 470
Total commercial ........................... $31,501 $ 825 $1,628 $1,102 $35,056
Commercial investor real estate mortgage ........... 8,755 1,300 2,301 1,265 13,621
Commercial investor real estate construction ......... 904 342 589 452 2,287
Total investor real estate ..................... $ 9,659 $1,642 $2,890 $1,717 $15,908
Accrual Non-accrual Total
(In millions)
Residential first mortgage .......................................... $14,613 $285 $14,898
Home equity ..................................................... 14,170 56 14,226
Indirect and other consumer ......................................... 2,776 — 2,776
Total consumer ............................................... $31,559 $341 $31,900
$82,864
144