Regions Bank 2010 Annual Report Download - page 80
Download and view the complete annual report
Please find page 80 of the 2010 Regions Bank annual report below. You can navigate through the pages in the report by either clicking on the pages listed below, or by using the keyword search tool below to find specific information within the annual report.-
 1
1 -
2
-
3
-
4
-
5
-
6
-
7
-
8
-
9
-
10
-
11
-
12
-
13
-
14
-
15
-
16
-
17
-
18
-
19
-
20
-
21
-
22
-
23
-
24
-
25
-
26
-
27
-
28
-
29
-
30
-
31
-
32
-
33
-
34
-
35
-
36
-
37
-
38
-
39
-
40
-
41
-
42
-
43
-
44
-
45
-
46
-
47
-
48
-
49
-
50
-
51
-
52
-
53
-
54
-
55
-
56
-
57
-
58
-
59
-
60
-
61
-
62
-
63
-
64
-
65
-
66
-
67
-
68
-
69
-
 70
70 -
 71
71 -
 72
72 -
 73
73 -
 74
74 -
 75
75 -
 76
76 -
 77
77 -
 78
78 -
 79
79 -
 80
80 -
 81
81 -
 82
82 -
 83
83 -
 84
84 -
 85
85 -
 86
86 -
 87
87 -
 88
88 -
 89
89 -
 90
90 -
91
-
92
-
93
-
94
-
95
-
96
-
97
-
98
-
99
-
100
-
101
-
102
-
103
-
104
-
105
-
106
-
107
-
108
-
109
-
110
-
111
-
112
-
113
-
114
-
115
-
116
-
117
-
118
-
119
-
120
-
121
-
122
-
123
-
124
-
125
-
126
-
127
-
128
-
129
-
130
-
131
-
132
-
133
-
134
-
135
-
136
-
137
-
138
-
139
-
140
-
141
-
142
-
143
-
144
-
145
-
146
-
147
-
148
-
149
-
150
-
151
-
152
-
153
-
154
-
155
-
156
-
157
-
158
-
159
-
160
-
161
-
162
-
163
-
164
-
165
-
166
-
167
-
168
-
169
-
170
-
171
-
172
-
173
-
174
-
175
-
176
-
177
-
178
-
179
-
180
-
181
-
182
-
183
-
184
-
185
-
186
-
187
-
188
-
189
-
190
-
191
-
192
-
193
-
194
-
195
-
196
-
197
-
198
-
199
-
200
-
201
-
202
-
203
-
204
-
205
-
206
-
207
-
208
-
209
-
210
-
211
-
212
-
213
-
214
-
215
-
216
-
217
-
218
-
219
-
220
-
221
-
222
-
223
-
224
-
225
-
226
-
227
-
228
-
229
-
230
-
231
-
232
-
233
-
234
-
235
-
236
 |
 |

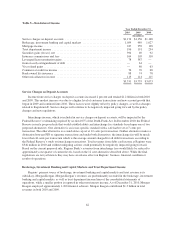
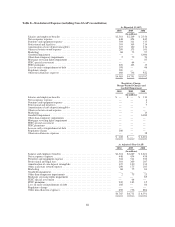
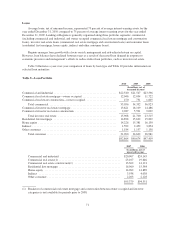
Table 8—Non-Interest Expense (including Non-GAAP reconciliation)
As Reported (GAAP)
2010 2009 2008
(In millions)
Salaries and employee benefits ....................................... $2,318 $2,269 $ 2,356
Net occupancy expense ............................................. 448 454 442
Furniture and equipment expense ..................................... 304 311 335
Professional and legal fees ........................................... 303 309 214
Amortization of core deposit intangibles ................................ 107 120 134
Other real estate owned expense ...................................... 209 175 103
Marketing ........................................................ 68 75 97
Goodwill impairment ............................................... — — 6,000
Other-than-temporary impairments .................................... 2 75 23
Mortgage servicing rights impairment .................................. — — 85
FDIC special assessment ............................................ — 64 —
FDIC premiums ................................................... 220 163 15
Loss on early extinguishment of debt .................................. 108 — 66
Regulatory charge ................................................. 200 — —
Other miscellaneous expenses ........................................ 698 736 922
$4,985 $4,751 $10,792
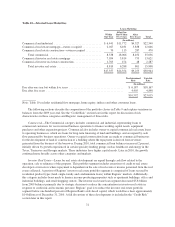
Regulatory Charge,
Merger-Related Charges and
Goodwill Impairment
2010 2009 2008
(In millions)
Salaries and employee benefits ....................................... $ — $ — $ 134
Net occupancy expense ............................................. — — 4
Furniture and equipment expense ..................................... — — 5
Professional and legal fees ........................................... — — 7
Amortization of core deposit intangibles ................................ — — —
Other real estate owned expense ...................................... — — —
Marketing ........................................................ — — 13
Goodwill impairment ............................................... — — 6,000
Other-than-temporary impairments .................................... — — —
Mortgage servicing rights impairment .................................. — — —
FDIC special assessment ............................................ — — —
FDIC premiums ................................................... — — —
Loss on early extinguishment of debt .................................. — — —
Regulatory charge ................................................. 200 — —
Other miscellaneous expenses ........................................ — — 38
$ 200 $ — $ 6,201
As Adjusted (Non-GAAP)
2010 2009 2008
(In millions)
Salaries and employee benefits ...................................... $2,318 $2,269 $ 2,222
Net occupancy expense ............................................ 448 454 438
Furniture and equipment expense .................................... 304 311 330
Professional and legal fees ......................................... 303 309 207
Amortization of core deposit intangibles .............................. 107 120 134
Other real estate owned expense ..................................... 209 175 103
Marketing ...................................................... 68 75 84
Goodwill impairment .............................................. — — —
Other-than-temporary impairments ................................... 2 75 23
Mortgage servicing rights impairment ................................ — — 85
FDIC special assessment ........................................... — 64 —
FDIC premiums .................................................. 220 163 15
Loss on early extinguishment of debt ................................. 108 — 66
Regulatory charge ................................................ — — —
Other miscellaneous expenses ....................................... 698 736 884
$4,785 $4,751 $ 4,591
66